| Zacks Company Profile for Buzzi SpA (BZZUF : OTC) |
|
|
| |
| • Company Description |
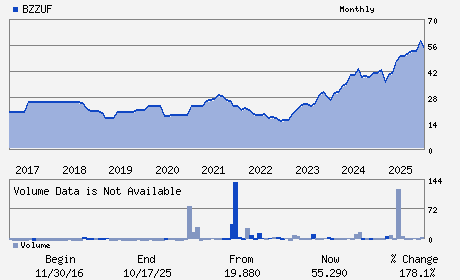
| Buzzi S.p.A., together with its subsidiaries, manufactures, distributes and sells cement, ready-mix concrete and aggregates. It operates primarily in Italy, the United States, Germany, Luxembourg, the Netherlands, Poland, the Czech Republic, Slovakia, Ukraine, Mexico and Brazil. Buzzi S.p.A., formerly known as Buzzi Unicem S.p.A., is based in Casale Monferrato, Italy.
Number of Employees: |
|
|
| |
| • Price / Volume Information |
| Yesterday's Closing Price: $50.50 |
Daily Weekly Monthly
 |
| 20 Day Moving Average: 417 shares |
| Shares Outstanding: 181.02 (millions) |
| Market Capitalization: $9,141.76 (millions) |
| Beta: 0.63 |
| 52 Week High: $63.80 |
| 52 Week Low: $50.00 |
| Short Interest Ratio: |
| |
% Price Change |
% Price Change Relative to S&P 500 |
| 4 Week |
-11.23% |
-15.57% |
| 12 Week |
-11.40% |
-18.10% |
| Year To Date |
-17.35% |
-24.01% |
|
|
|
|
| |
|
|
| |
| • General Corporate Information |
Officers
Enrico Buzzi - Chairman
Veronica Buzzi - Vice-Chairman
Marco Weigmann - Director
Elsa Fornero - Director
Maurizio Sella - Director
|
|
Peer Information
- (-)
- (-)
- (-)
- (-)
- (-)
- (-)
|
|
Industry / Sector / Ticker Info
Analyst Coverage: No
Industry Group: BLDG-CMT/CNT/AG
Sector: Construction
CUSIP: T2320M109
SIC: 3241
|
|
Fiscal Year
Fiscal Year End: December
Last Reported Quarter: -
Next Expected EPS Date: -
|
|
Share - Related Items
Shares Outstanding: 181.02
Most Recent Split Date: (:1)
Beta: 0.63
Market Capitalization: $9,141.76 (millions)
|
|
|
|
|
| |
| • EPS Information |
• Dividend Information |
| Analyst Coverage: No |
Dividend Yield: 0.00% |
| Current Fiscal Quarter EPS Consensus Estimate: $ |
Indicated Annual Dividend: $0.00 |
| Current Fiscal Year EPS Consensus Estimate: $3.09 |
Payout Ratio: |
| Number of Estimates in the Fiscal Year Consensus: 1.00 |
Change In Payout Ratio: |
| Estmated Long-Term EPS Growth Rate: % |
Last Dividend Paid: NA - $0.00 |
| Next EPS Report Date: - |
|
|
|
| |