| Zacks Company Profile for CBRE Group, Inc. (CBRE : NYSE) |
|
|
| |
| • Company Description |
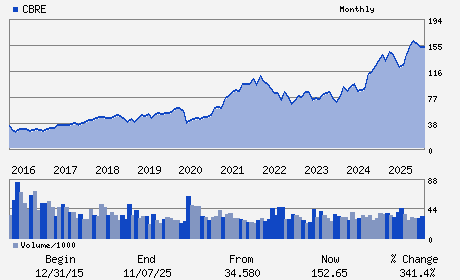
| CBRE Group, Inc. is a commercial real estate services and investment firm, offering a wide range of services to tenants, owners, lenders and investors in office, retail, industrial, multi-family and other types of commercial real estates in all major metropolitan areas across the globe. The services include facilities, transaction and project management; property management; investment management; appraisal and valuation; property leasing; strategic consulting; property sales; mortgage services and development services. CBRE Group reports on three global business segments: Advisory Services, Global Workplace Solutions and Real Estate Investments. Advisory Services offers services in property leasing, sales, mortgage services, management and valuation. Global Workplace Solutions offers integrated, contractually-based outsourcing services to occupiers of real estate. Real Estate Investments includes investment management services provided globally, development services and flexible office space solutions.
Number of Employees: 155,000 |
|
|
| |
| • Price / Volume Information |
| Yesterday's Closing Price: $131.07 |
Daily Weekly Monthly
 |
| 20 Day Moving Average: 2,130,018 shares |
| Shares Outstanding: 292.82 (millions) |
| Market Capitalization: $38,379.52 (millions) |
| Beta: 1.28 |
| 52 Week High: $174.27 |
| 52 Week Low: $118.81 |
| Short Interest Ratio: |
| |
% Price Change |
% Price Change Relative to S&P 500 |
| 4 Week |
-12.22% |
-16.50% |
| 12 Week |
-12.62% |
-19.22% |
| Year To Date |
-18.48% |
-25.07% |
|
|
|
|
| |
| • Address & Contact Information |
| Street Address |
Phone / Fax |
Email Address |
Web URL |
2121 NORTH PEARL STREET SUITE 300
-
DALLAS,TX 75201
USA |
ph: 214-979-6100
fax: 213-613-3005 |
chandni.luthra@cbre.com |
http://www.cbre.com |
|
|
| |
| • General Corporate Information |
Officers
Robert E. Sulentic - Chief Executive Officer; Chair of the Board and Pr
Emma E. Giamartino - Chief Financial Officer
Andrew S. Horn - Chief Accounting Officer
Brandon B. Boze - Director
Vincent Clancy - Director
|
|
Peer Information
CBRE Group, Inc. (ARL)
CBRE Group, Inc. (FNDOY)
CBRE Group, Inc. (AOXY)
CBRE Group, Inc. (HLDCY)
CBRE Group, Inc. (IOR)
CBRE Group, Inc. (GYRO)
|
|
Industry / Sector / Ticker Info
Analyst Coverage: No
Industry Group: REAL ESTATE OPS
Sector: Finance
CUSIP: 12504L109
SIC: 6500
|
|
Fiscal Year
Fiscal Year End: December
Last Reported Quarter: 03/01/26
Next Expected EPS Date: 08/04/26
|
|
Share - Related Items
Shares Outstanding: 292.82
Most Recent Split Date: 6.00 (3.00:1)
Beta: 1.28
Market Capitalization: $38,379.52 (millions)
|
|
|
|
|
| |
| • EPS Information |
• Dividend Information |
| Analyst Coverage: No |
Dividend Yield: 0.00% |
| Current Fiscal Quarter EPS Consensus Estimate: $1.49 |
Indicated Annual Dividend: $0.00 |
| Current Fiscal Year EPS Consensus Estimate: $7.72 |
Payout Ratio: 0.00 |
| Number of Estimates in the Fiscal Year Consensus: 2.00 |
Change In Payout Ratio: 0.00 |
| Estmated Long-Term EPS Growth Rate: % |
Last Dividend Paid: NA - $0.00 |
| Next EPS Report Date: 08/04/26 |
|
|
|
| |