| Zacks Company Profile for Community Financial System, Inc. (CBU : NYSE) |
|
|
| |
| • Company Description |
| Community Financial System Inc. is a diversified financial services company. It focused on business lines which includes banking, employee benefit services, insurance services and wealth management. Community Financial System Inc., formerly known as Community Bank System Inc., SYRACUSE, N.Y.
Number of Employees: 3,001 |
|
|
| |
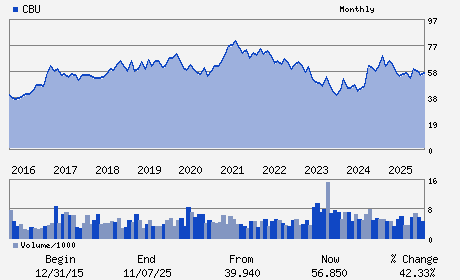
| • Price / Volume Information |
| Yesterday's Closing Price: $63.41 |
Daily Weekly Monthly
 |
| 20 Day Moving Average: 229,638 shares |
| Shares Outstanding: 52.56 (millions) |
| Market Capitalization: $3,332.51 (millions) |
| Beta: 0.78 |
| 52 Week High: $67.50 |
| 52 Week Low: $51.12 |
| Short Interest Ratio: |
| |
% Price Change |
% Price Change Relative to S&P 500 |
| 4 Week |
0.46% |
-4.45% |
| 12 Week |
0.65% |
-6.95% |
| Year To Date |
10.39% |
1.09% |
|
|
|
|
| |
|
|
| |
| • General Corporate Information |
Officers
Dimitar A. Karaivanov - President and Chief Executive Officer
Eric E. Stickels - Chairman and Director
Marya Burgio Wlos - Executive Vice President; Treasurer and Chief Fina
Deresa F. Durkee - Senior Vice President and Chief Accounting Officer
Mark J. Bolus - Director
|
|
Peer Information
Community Financial System, Inc. (EIIN)
Community Financial System, Inc. (AFMI)
Community Financial System, Inc. (DRL)
Community Financial System, Inc. (GRFPY)
Community Financial System, Inc. (IGOT)
Community Financial System, Inc. (ATLC)
|
|
Industry / Sector / Ticker Info
Analyst Coverage: No
Industry Group: FIN-MISC SVCS
Sector: Finance
CUSIP: 203607106
SIC: 6021
|
|
Fiscal Year
Fiscal Year End: December
Last Reported Quarter: 03/01/26
Next Expected EPS Date: 07/28/26
|
|
Share - Related Items
Shares Outstanding: 52.56
Most Recent Split Date: 4.00 (2.00:1)
Beta: 0.78
Market Capitalization: $3,332.51 (millions)
|
|
|
|
|
| |
| • EPS Information |
• Dividend Information |
| Analyst Coverage: No |
Dividend Yield: 2.96% |
| Current Fiscal Quarter EPS Consensus Estimate: $1.20 |
Indicated Annual Dividend: $1.88 |
| Current Fiscal Year EPS Consensus Estimate: $4.74 |
Payout Ratio: 0.45 |
| Number of Estimates in the Fiscal Year Consensus: 4.00 |
Change In Payout Ratio: -0.05 |
| Estmated Long-Term EPS Growth Rate: % |
Last Dividend Paid: 03/16/2026 - $0.47 |
| Next EPS Report Date: 07/28/26 |
|
|
|
| |