| Zacks Company Profile for CareDx, Inc. (CDNA : NSDQ) |
|
|
| |
| • Company Description |
| CareDx, Inc. is a commercial stage company. It develops, markets, and delivers a diagnostic surveillance solution for heart transplant recipients. The Company provides AlloMap, a noninvasive blood test used to aid in the identification of heart transplant recipients. It is also pursuing other areas of transplant surveillance, such as the use of cell-free DNA (cfDNA) as a biomarker for rejection. CareDx, Inc. is based in Brisbane, California.
Number of Employees: 765 |
|
|
| |
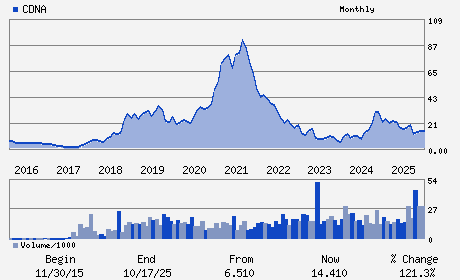
| • Price / Volume Information |
| Yesterday's Closing Price: $21.63 |
Daily Weekly Monthly
 |
| 20 Day Moving Average: 736,812 shares |
| Shares Outstanding: 51.66 (millions) |
| Market Capitalization: $1,117.38 (millions) |
| Beta: 2.49 |
| 52 Week High: $23.24 |
| 52 Week Low: $10.96 |
| Short Interest Ratio: |
| |
% Price Change |
% Price Change Relative to S&P 500 |
| 4 Week |
7.83% |
2.56% |
| 12 Week |
14.93% |
6.25% |
| Year To Date |
14.81% |
5.26% |
|
|
|
|
| |
| • Address & Contact Information |
| Street Address |
Phone / Fax |
Email Address |
Web URL |
8000 Marina Boulevard 4th Floor
-
Brisbane,CA 94005
USA |
ph: 415-287-2300
fax: 415-287-2450 |
investor@caredx.com |
http://www.caredx.com |
|
|
| |
| • General Corporate Information |
Officers
John W. Hanna - President and Chief Executive Officer
Nathan Smith - Chief Financial Officer
Fred E. Cohen - Director
Christine M. Cournoyer - Director
Michael D. Goldberg - Director
|
|
Peer Information
CareDx, Inc. (CHCR)
CareDx, Inc. (ESRX)
CareDx, Inc. (MYDP)
CareDx, Inc. (COR)
CareDx, Inc. (GBCS)
CareDx, Inc. (LAXAF)
|
|
Industry / Sector / Ticker Info
Analyst Coverage: No
Industry Group: Medical Services
Sector: Medical
CUSIP: 14167L103
SIC: 8071
|
|
Fiscal Year
Fiscal Year End: December
Last Reported Quarter: 03/01/26
Next Expected EPS Date: 08/05/26
|
|
Share - Related Items
Shares Outstanding: 51.66
Most Recent Split Date: (:1)
Beta: 2.49
Market Capitalization: $1,117.38 (millions)
|
|
|
|
|
| |
| • EPS Information |
• Dividend Information |
| Analyst Coverage: No |
Dividend Yield: 0.00% |
| Current Fiscal Quarter EPS Consensus Estimate: $0.06 |
Indicated Annual Dividend: $0.00 |
| Current Fiscal Year EPS Consensus Estimate: $0.22 |
Payout Ratio: |
| Number of Estimates in the Fiscal Year Consensus: 1.00 |
Change In Payout Ratio: |
| Estmated Long-Term EPS Growth Rate: % |
Last Dividend Paid: NA - $0.00 |
| Next EPS Report Date: 08/05/26 |
|
|
|
| |