| Zacks Company Profile for Chegg, Inc. (CHGG : NYSE) |
|
|
| |
| • Company Description |
| Chegg, Inc. is a student-first online learning platform that supports millions of learners around the world with study help, math help, writing help, practice problems, flashcards, access to books and etextbooks, and more. Chegg also supports life-long learners from school into their careers with personal and professional development skills training, via Chegg Skills.
Number of Employees: 595 |
|
|
| |
| • Price / Volume Information |
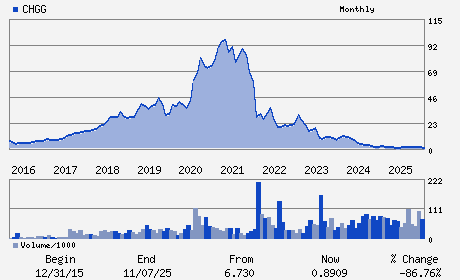
| Yesterday's Closing Price: $1.09 |
Daily Weekly Monthly
 |
| 20 Day Moving Average: 1,386,455 shares |
| Shares Outstanding: 109.27 (millions) |
| Market Capitalization: $119.11 (millions) |
| Beta: 1.86 |
| 52 Week High: $1.90 |
| 52 Week Low: $0.45 |
| Short Interest Ratio: |
| |
% Price Change |
% Price Change Relative to S&P 500 |
| 4 Week |
92.17% |
81.28% |
| 12 Week |
42.88% |
39.88% |
| Year To Date |
17.20% |
14.24% |
|
|
|
|
| |
| • Address & Contact Information |
| Street Address |
Phone / Fax |
Email Address |
Web URL |
2261 MARKET STREET STE 46218
-
SAN FRANCISCO,CA 94114
USA |
ph: 408-855-5700
fax: - |
ir@chegg.com |
http://www.chegg.com |
|
|
| |
| • General Corporate Information |
Officers
Dan Rosensweig - Chief Executive Officer and Executive Chairman
David Longo - Chief Financial Officer
Renee Budig - Director
Marne Levine - Director
Ted Schlein - Director
|
|
Peer Information
Chegg, Inc. (ADP)
Chegg, Inc. (CWLD)
Chegg, Inc. (CYBA.)
Chegg, Inc. (ZVLO)
Chegg, Inc. (AZPN)
Chegg, Inc. (ATIS)
|
|
Industry / Sector / Ticker Info
Analyst Coverage: No
Industry Group: INTERNET SOFTWARE
Sector: Computer and Technology
CUSIP: 163092109
SIC: 8200
|
|
Fiscal Year
Fiscal Year End: December
Last Reported Quarter: 12/01/25
Next Expected EPS Date: 05/11/26
|
|
Share - Related Items
Shares Outstanding: 109.27
Most Recent Split Date: (:1)
Beta: 1.86
Market Capitalization: $119.11 (millions)
|
|
|
|
|
| |
| • EPS Information |
• Dividend Information |
| Analyst Coverage: No |
Dividend Yield: 0.00% |
| Current Fiscal Quarter EPS Consensus Estimate: $-0.06 |
Indicated Annual Dividend: $0.00 |
| Current Fiscal Year EPS Consensus Estimate: $-0.31 |
Payout Ratio: |
| Number of Estimates in the Fiscal Year Consensus: 1.00 |
Change In Payout Ratio: |
| Estmated Long-Term EPS Growth Rate: % |
Last Dividend Paid: NA - $0.00 |
| Next EPS Report Date: 05/11/26 |
|
|
|
| |