| Zacks Company Profile for Clearfield, Inc. (CLFD : NSDQ) |
|
|
| |
| • Company Description |
| CLEARFIELD INC., formerly APA Cables & Networks, designs and manufactures the FieldSmart fiber management platform, which includes its latest generation Fiber Distribution System and Fiber Scalability Center. The FDS and FSC product-lines support a wide range of panel configurations, densities, connectors and adapter options and is offered alongside an assortment of passive optical components. Clearfield also provides a complete line of fiber and copper assemblies for controlled and outside plant environments.
Number of Employees: 243 |
|
|
| |
| • Price / Volume Information |
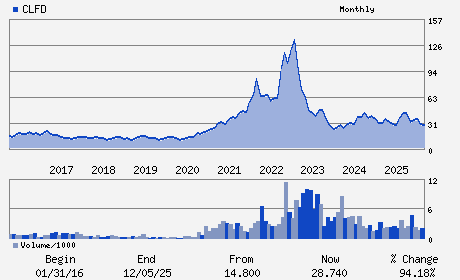
| Yesterday's Closing Price: $27.82 |
Daily Weekly Monthly
 |
| 20 Day Moving Average: 160,111 shares |
| Shares Outstanding: 13.69 (millions) |
| Market Capitalization: $380.73 (millions) |
| Beta: 2.00 |
| 52 Week High: $46.76 |
| 52 Week Low: $23.76 |
| Short Interest Ratio: |
| |
% Price Change |
% Price Change Relative to S&P 500 |
| 4 Week |
-2.28% |
-7.82% |
| 12 Week |
-9.82% |
-11.71% |
| Year To Date |
-4.56% |
-6.97% |
|
|
|
|
| |
|
|
| |
| • General Corporate Information |
Officers
Cheryl Beranek - President; Chief Executive Officer
Daniel Herzog - Chief Financial Officer
Ronald G. Roth - Director
Catherine T. Kelly - Director
Donald R. Hayward - Director
|
|
Peer Information
Clearfield, Inc. (CMTL)
Clearfield, Inc. (UMAC)
Clearfield, Inc. (ANEN)
Clearfield, Inc. (ERIC)
Clearfield, Inc. (CLUS)
Clearfield, Inc. (BKTI)
|
|
Industry / Sector / Ticker Info
Analyst Coverage: No
Industry Group: Wireless Equipment
Sector: Computer and Technology
CUSIP: 18482P103
SIC: 3661
|
|
Fiscal Year
Fiscal Year End: September
Last Reported Quarter: 12/01/25
Next Expected EPS Date: 05/14/26
|
|
Share - Related Items
Shares Outstanding: 13.69
Most Recent Split Date: 4.00 (2.00:1)
Beta: 2.00
Market Capitalization: $380.73 (millions)
|
|
|
|
|
| |
| • EPS Information |
• Dividend Information |
| Analyst Coverage: No |
Dividend Yield: 0.00% |
| Current Fiscal Quarter EPS Consensus Estimate: $0.19 |
Indicated Annual Dividend: $0.00 |
| Current Fiscal Year EPS Consensus Estimate: $0.67 |
Payout Ratio: 0.00 |
| Number of Estimates in the Fiscal Year Consensus: 2.00 |
Change In Payout Ratio: 0.00 |
| Estmated Long-Term EPS Growth Rate: % |
Last Dividend Paid: NA - $0.00 |
| Next EPS Report Date: 05/14/26 |
|
|
|
| |