| Zacks Company Profile for Calumet, Inc. (CLMT : NSDQ) |
|
|
| |
| • Company Description |
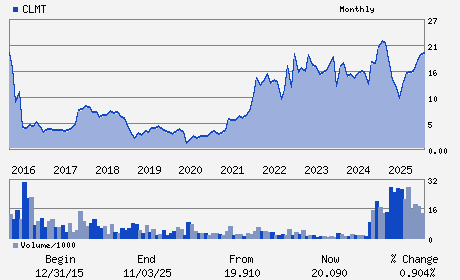
| Calumet Inc. manufactures, formulates and markets a diversified slate of specialty branded products and renewable fuels to customers across a broad range of consumer-facing and industrial markets. Calumet Inc., formerly known as Calumet Specialty Products Partners L.P., is based in INDIANAPOLIS.
Number of Employees: 1,540 |
|
|
| |
| • Price / Volume Information |
| Yesterday's Closing Price: $32.07 |
Daily Weekly Monthly
 |
| 20 Day Moving Average: 1,391,485 shares |
| Shares Outstanding: 86.78 (millions) |
| Market Capitalization: $2,782.92 (millions) |
| Beta: 0.86 |
| 52 Week High: $36.94 |
| 52 Week Low: $8.88 |
| Short Interest Ratio: |
| |
% Price Change |
% Price Change Relative to S&P 500 |
| 4 Week |
14.29% |
5.80% |
| 12 Week |
49.37% |
46.03% |
| Year To Date |
61.40% |
55.41% |
|
|
|
|
| |
| • Address & Contact Information |
| Street Address |
Phone / Fax |
Email Address |
Web URL |
1060 N Capitol Ave Suite 6-401
-
INDIANAPOLIS,IN 46204
USA |
ph: 317-328-5660
fax: 317-328-2359 |
clmt@alpha-ir.com |
https://calumet.com |
|
|
| |
| • General Corporate Information |
Officers
Todd Borgmann - President and Chief Executive Officer
Stephen P. Mawer - Chairman
David Lunin - Executive Vice President and Chief Financial Offic
Julio M. Quintana - Director
Karen A. Twitchell - Director
|
|
Peer Information
Calumet, Inc. (HES)
Calumet, Inc. (CWPE)
Calumet, Inc. (EPCC.)
Calumet, Inc. (PHX)
Calumet, Inc. (NFG)
Calumet, Inc. (KMG.)
|
|
Industry / Sector / Ticker Info
Analyst Coverage: No
Industry Group: OIL-US INTEGRTD
Sector: Oils/Energy
CUSIP: 131428104
SIC: 2911
|
|
Fiscal Year
Fiscal Year End: December
Last Reported Quarter: 12/01/25
Next Expected EPS Date: 05/08/26
|
|
Share - Related Items
Shares Outstanding: 86.78
Most Recent Split Date: (:1)
Beta: 0.86
Market Capitalization: $2,782.92 (millions)
|
|
|
|
|
| |
| • EPS Information |
• Dividend Information |
| Analyst Coverage: No |
Dividend Yield: 0.00% |
| Current Fiscal Quarter EPS Consensus Estimate: $-0.21 |
Indicated Annual Dividend: $0.00 |
| Current Fiscal Year EPS Consensus Estimate: $-0.20 |
Payout Ratio: |
| Number of Estimates in the Fiscal Year Consensus: 3.00 |
Change In Payout Ratio: |
| Estmated Long-Term EPS Growth Rate: 39.11% |
Last Dividend Paid: NA - $0.00 |
| Next EPS Report Date: 05/08/26 |
|
|
|
| |