| Zacks Company Profile for Commerce.com, Inc. (CMRC : NSDQ) |
|
|
| |
| • Company Description |
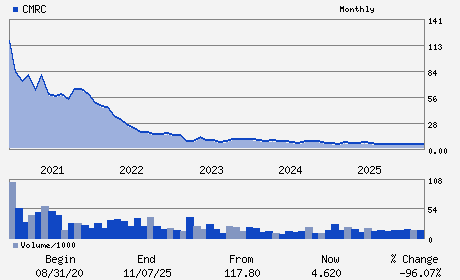
| Commerce.com, Inc. is a provider of an open, intelligent ecosystem of technology solutions. Commerce.com, Inc., formerly known as BigCommerce Holdings Inc., is based in AUSTIN, Texas.
Number of Employees: 1,079 |
|
|
| |
| • Price / Volume Information |
| Yesterday's Closing Price: $2.59 |
Daily Weekly Monthly
 |
| 20 Day Moving Average: 564,395 shares |
| Shares Outstanding: 82.20 (millions) |
| Market Capitalization: $212.90 (millions) |
| Beta: 1.16 |
| 52 Week High: $5.59 |
| 52 Week Low: $2.41 |
| Short Interest Ratio: |
| |
% Price Change |
% Price Change Relative to S&P 500 |
| 4 Week |
-4.07% |
-9.51% |
| 12 Week |
-22.45% |
-24.08% |
| Year To Date |
-37.14% |
-38.72% |
|
|
|
|
| |
|
|
| |
| • General Corporate Information |
Officers
Travis Hess - Chief Executive Officer
Ellen F. Siminoff - Executive Chair of the Board
Daniel Lentz - Chief Financial Officer and Chief Operating Office
Hubert Ban - Senior Vice President
Anil Kamath - Director
|
|
Peer Information
Commerce.com, Inc. (COOL.)
Commerce.com, Inc. (GFME)
Commerce.com, Inc. (GSVI)
Commerce.com, Inc. (GDENZ)
Commerce.com, Inc. (EMUS)
Commerce.com, Inc. (BFLY.)
|
|
Industry / Sector / Ticker Info
Analyst Coverage: No
Industry Group: INTERNET COMMERCE
Sector: Retail/Wholesale
CUSIP: 08975P108
SIC: 7372
|
|
Fiscal Year
Fiscal Year End: December
Last Reported Quarter: 12/01/25
Next Expected EPS Date: 05/14/26
|
|
Share - Related Items
Shares Outstanding: 82.20
Most Recent Split Date: (:1)
Beta: 1.16
Market Capitalization: $212.90 (millions)
|
|
|
|
|
| |
| • EPS Information |
• Dividend Information |
| Analyst Coverage: No |
Dividend Yield: 0.00% |
| Current Fiscal Quarter EPS Consensus Estimate: $0.00 |
Indicated Annual Dividend: $0.00 |
| Current Fiscal Year EPS Consensus Estimate: $0.11 |
Payout Ratio: |
| Number of Estimates in the Fiscal Year Consensus: 3.00 |
Change In Payout Ratio: |
| Estmated Long-Term EPS Growth Rate: 25.18% |
Last Dividend Paid: NA - $0.00 |
| Next EPS Report Date: 05/14/26 |
|
|
|
| |