| Zacks Company Profile for Cannae Holdings, Inc. (CNNE : NYSE) |
|
|
| |
| • Company Description |
| Cannae Holdings, Inc. holds majority and minority equity investment stakes in a number of entities, including Ceridian Holdings, LLC, American Blue Ribbon Holdings, LLC and T-System Holding LLC. Cannae Holdings, Inc., formerly known as Fidelity National Financial Inc., is based in FL, United States.
Number of Employees: 6,602 |
|
|
| |
| • Price / Volume Information |
| Yesterday's Closing Price: $13.86 |
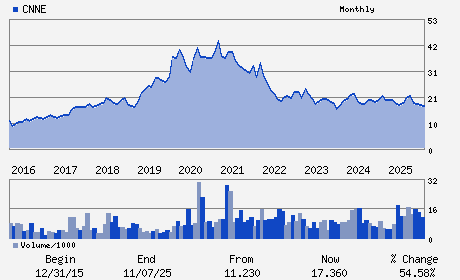
Daily Weekly Monthly
 |
| 20 Day Moving Average: 502,247 shares |
| Shares Outstanding: 43.94 (millions) |
| Market Capitalization: $609.02 (millions) |
| Beta: 1.18 |
| 52 Week High: $21.96 |
| 52 Week Low: $10.46 |
| Short Interest Ratio: |
| |
% Price Change |
% Price Change Relative to S&P 500 |
| 4 Week |
6.04% |
0.86% |
| 12 Week |
10.26% |
1.93% |
| Year To Date |
-11.89% |
-20.86% |
|
|
|
|
| |
| • Address & Contact Information |
| Street Address |
Phone / Fax |
Email Address |
Web URL |
1701 VILLAGE CENTER CIRCLE
-
LAS VEGAS,NV 89134
USA |
ph: 702-323-7330
fax: - |
None |
http://www.cannaeholdings.com |
|
|
| |
| • General Corporate Information |
Officers
Ryan R. Caswell - Chief Executive Officer
Douglas K. Ammerman - Chairman of the Board
William P. Foley - Vice Chairman of the Board
Bryan D. Coy - Executive Vice President and Chief Financial Offic
Mona Aboelnaga Kanaan - Director
|
|
Peer Information
Cannae Holdings, Inc. (INSI)
Cannae Holdings, Inc. (WI)
Cannae Holdings, Inc. (SGSP)
Cannae Holdings, Inc. (DTGP)
Cannae Holdings, Inc. (AB)
Cannae Holdings, Inc. (GUORY)
|
|
Industry / Sector / Ticker Info
Analyst Coverage: No
Industry Group: FIN-INVEST MGMT
Sector: Finance
CUSIP: 13765N107
SIC: 5810
|
|
Fiscal Year
Fiscal Year End: December
Last Reported Quarter: 03/01/26
Next Expected EPS Date: 08/10/26
|
|
Share - Related Items
Shares Outstanding: 43.94
Most Recent Split Date: (:1)
Beta: 1.18
Market Capitalization: $609.02 (millions)
|
|
|
|
|
| |
| • EPS Information |
• Dividend Information |
| Analyst Coverage: No |
Dividend Yield: 4.33% |
| Current Fiscal Quarter EPS Consensus Estimate: $-0.50 |
Indicated Annual Dividend: $0.60 |
| Current Fiscal Year EPS Consensus Estimate: $-2.40 |
Payout Ratio: |
| Number of Estimates in the Fiscal Year Consensus: 1.00 |
Change In Payout Ratio: |
| Estmated Long-Term EPS Growth Rate: % |
Last Dividend Paid: 03/17/2026 - $0.15 |
| Next EPS Report Date: 08/10/26 |
|
|
|
| |