| Zacks Company Profile for Cohu, Inc. (COHU : NSDQ) |
|
|
| |
| • Company Description |
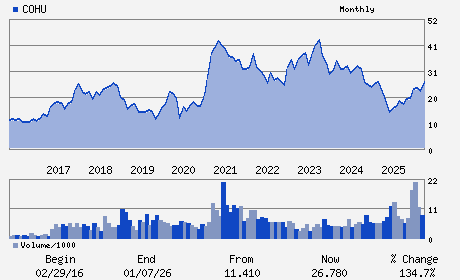
| Cohu is a leading supplier of semiconductor test and inspection handlers, micro-electro mechanical system (MEMS) test modules, test contactors and thermal sub-systems used by global semiconductor manufacturers and test subcontractors.
Number of Employees: 2,857 |
|
|
| |
| • Price / Volume Information |
| Yesterday's Closing Price: $38.95 |
Daily Weekly Monthly
 |
| 20 Day Moving Average: 643,108 shares |
| Shares Outstanding: 47.17 (millions) |
| Market Capitalization: $1,837.13 (millions) |
| Beta: 1.24 |
| 52 Week High: $39.53 |
| 52 Week Low: $13.66 |
| Short Interest Ratio: |
| |
% Price Change |
% Price Change Relative to S&P 500 |
| 4 Week |
27.87% |
20.62% |
| 12 Week |
30.79% |
28.05% |
| Year To Date |
67.38% |
63.15% |
|
|
|
|
| |
| • Address & Contact Information |
| Street Address |
Phone / Fax |
Email Address |
Web URL |
12367 CROSTHWAITE CIRCLE
-
POWAY,CA 92064
USA |
ph: 858-848-8100
fax: 858-848-8185 |
corp@cohu.com |
http://www.cohu.com |
|
|
| |
| • General Corporate Information |
Officers
Luis A. Muller - President and Chief Executive Officer; Director
James A. Donahue - Chairperson of the Board
Jeffrey D. Jones - Senior Vice President; Finance and CFO
William E. Bendush - Director
Steven J. Bilodeau - Director
|
|
Peer Information
Cohu, Inc. (BESIY)
Cohu, Inc. (NEXT2)
Cohu, Inc. (EGLSQ)
Cohu, Inc. (BTUI)
Cohu, Inc. (DAWKQ)
Cohu, Inc. (EMKR)
|
|
Industry / Sector / Ticker Info
Analyst Coverage: No
Industry Group: ELEC-MANUFT MACH
Sector: Computer and Technology
CUSIP: 192576106
SIC: 3825
|
|
Fiscal Year
Fiscal Year End: December
Last Reported Quarter: 12/01/25
Next Expected EPS Date: 05/07/26
|
|
Share - Related Items
Shares Outstanding: 47.17
Most Recent Split Date: 9.00 (2.00:1)
Beta: 1.24
Market Capitalization: $1,837.13 (millions)
|
|
|
|
|
| |
| • EPS Information |
• Dividend Information |
| Analyst Coverage: No |
Dividend Yield: 0.00% |
| Current Fiscal Quarter EPS Consensus Estimate: $0.05 |
Indicated Annual Dividend: $0.00 |
| Current Fiscal Year EPS Consensus Estimate: $0.12 |
Payout Ratio: |
| Number of Estimates in the Fiscal Year Consensus: 3.00 |
Change In Payout Ratio: |
| Estmated Long-Term EPS Growth Rate: % |
Last Dividend Paid: NA - $0.00 |
| Next EPS Report Date: 05/07/26 |
|
|
|
| |