| Zacks Company Profile for Collegium Pharmaceutical, Inc. (COLL : NSDQ) |
|
|
| |
| • Company Description |
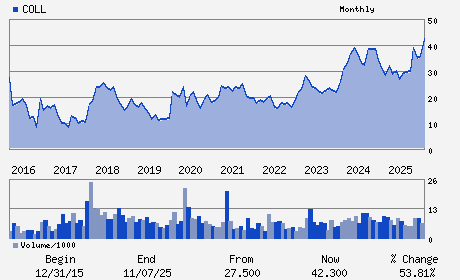
| Collegium Pharmaceutical Inc. is a specialty pharmaceutical company. It develops and commercializes prescription and over-the-counter pharmaceuticals for the treatment of central nervous system, respiratory and skin related disorders. The Company's product candidate consists of COL-195, COL-196, COL-171, COL-003 and COL-172 which are in different clinical trial. It developed a formulation platform technology, DETERx, for the treatment of chronic pain. Collegium Pharmaceutical Inc. is based in CUMBERLAND, United States.
Number of Employees: 423 |
|
|
| |
| • Price / Volume Information |
| Yesterday's Closing Price: $34.07 |
Daily Weekly Monthly
 |
| 20 Day Moving Average: 465,218 shares |
| Shares Outstanding: 32.43 (millions) |
| Market Capitalization: $1,105.03 (millions) |
| Beta: 0.76 |
| 52 Week High: $50.79 |
| 52 Week Low: $28.34 |
| Short Interest Ratio: |
| |
% Price Change |
% Price Change Relative to S&P 500 |
| 4 Week |
5.55% |
0.39% |
| 12 Week |
-22.95% |
-28.77% |
| Year To Date |
-26.41% |
-31.65% |
|
|
|
|
| |
|
|
| |
| • General Corporate Information |
Officers
Vikram Karnani - Chief Executive Officer and President
Gino Santini - Chairman
Colleen Tupper - Executive Vice President and Chief Financial Offic
Rita Balice-Gordon - Director
Garen G. Bohlin - Director
|
|
Peer Information
Collegium Pharmaceutical, Inc. (GSAC)
Collegium Pharmaceutical, Inc. (CASIF)
Collegium Pharmaceutical, Inc. (ALCD.)
Collegium Pharmaceutical, Inc. (OMNN)
Collegium Pharmaceutical, Inc. (CGPI.)
Collegium Pharmaceutical, Inc. (CATX)
|
|
Industry / Sector / Ticker Info
Analyst Coverage: No
Industry Group: MED-DRUGS
Sector: Medical
CUSIP: 19459J104
SIC: 2834
|
|
Fiscal Year
Fiscal Year End: December
Last Reported Quarter: 03/01/26
Next Expected EPS Date: 08/06/26
|
|
Share - Related Items
Shares Outstanding: 32.43
Most Recent Split Date: (:1)
Beta: 0.76
Market Capitalization: $1,105.03 (millions)
|
|
|
|
|
| |
| • EPS Information |
• Dividend Information |
| Analyst Coverage: No |
Dividend Yield: 0.00% |
| Current Fiscal Quarter EPS Consensus Estimate: $1.48 |
Indicated Annual Dividend: $0.00 |
| Current Fiscal Year EPS Consensus Estimate: $6.76 |
Payout Ratio: 0.00 |
| Number of Estimates in the Fiscal Year Consensus: 3.00 |
Change In Payout Ratio: 0.00 |
| Estmated Long-Term EPS Growth Rate: % |
Last Dividend Paid: NA - $0.00 |
| Next EPS Report Date: 08/06/26 |
|
|
|
| |