| Zacks Company Profile for Conn's, Inc. (CONNQ : OTC) |
|
|
| |
| • Company Description |
| Conns Inc is a specialty retailer currently operating retail locations in Texas and Louisiana. It sells major home appliances, including refrigerators, freezers, washers, dryers and ranges, and a variety of consumer electronics, including projection, plasma and LCD televisions, camcorders, VCRs, DVD players and home theater products. They also sell home office equipment, lawn and garden products and bedding, and continue to introduce additional product categories for the home to help increase same store sales and to respond to their customers' product needs.
Number of Employees: |
|
|
| |
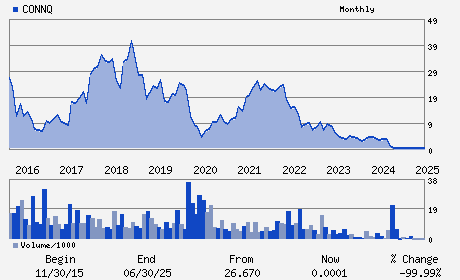
| • Price / Volume Information |
| Yesterday's Closing Price: $ |
Daily Weekly Monthly
 |
| 20 Day Moving Average: shares |
| Shares Outstanding: 24.89 (millions) |
| Market Capitalization: $ (millions) |
| Beta: |
| 52 Week High: $0.00 |
| 52 Week Low: $0.00 |
| Short Interest Ratio: |
| |
% Price Change |
% Price Change Relative to S&P 500 |
| 4 Week |
% |
% |
| 12 Week |
% |
% |
| Year To Date |
% |
% |
|
|
|
|
| |
|
|
| |
| • General Corporate Information |
Officers
Norman L. Miller - President and Chief Executive Officer
Timothy Santo - Chief Financial Officer
Bob L. Martin - Director
William E. Saunders - Director
Douglas H. Martin - Director
|
|
Peer Information
- (-)
- (-)
- (-)
- (-)
- (-)
- (-)
|
|
Industry / Sector / Ticker Info
Analyst Coverage: No
Industry Group: RETAIL-CONS ELC
Sector: Retail/Wholesale
CUSIP: 208242107
SIC: 5731
|
|
Fiscal Year
Fiscal Year End: January
Last Reported Quarter: -
Next Expected EPS Date: -
|
|
Share - Related Items
Shares Outstanding: 24.89
Most Recent Split Date: (:1)
Beta:
Market Capitalization: $ (millions)
|
|
|
|
|
| |
| • EPS Information |
• Dividend Information |
| Analyst Coverage: No |
Dividend Yield: % |
| Current Fiscal Quarter EPS Consensus Estimate: $ |
Indicated Annual Dividend: $0.00 |
| Current Fiscal Year EPS Consensus Estimate: $ |
Payout Ratio: |
| Number of Estimates in the Fiscal Year Consensus: |
Change In Payout Ratio: |
| Estmated Long-Term EPS Growth Rate: % |
Last Dividend Paid: NA - $0.00 |
| Next EPS Report Date: - |
|
|
|
| |