| Zacks Company Profile for CareTrust REIT, Inc. (CTRE : NYSE) |
|
|
| |
| • Company Description |
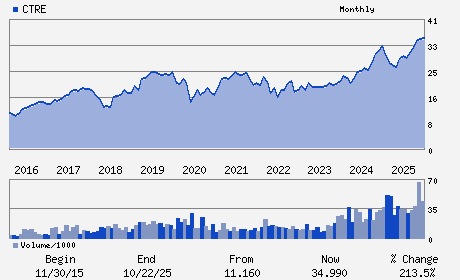
| CareTrust REIT, Inc. is a real estate investment trust. It is primarily engaged in the ownership, acquisition and leasing of healthcare-related properties. The Company leases healthcare facilities to healthcare operators in triple-net lease arrangements. CareTrust REIT, Inc. is based in United States.
Number of Employees: 43 |
|
|
| |
| • Price / Volume Information |
| Yesterday's Closing Price: $41.14 |
Daily Weekly Monthly
 |
| 20 Day Moving Average: 2,368,771 shares |
| Shares Outstanding: 236.24 (millions) |
| Market Capitalization: $9,718.91 (millions) |
| Beta: 0.76 |
| 52 Week High: $43.08 |
| 52 Week Low: $27.81 |
| Short Interest Ratio: |
| |
% Price Change |
% Price Change Relative to S&P 500 |
| 4 Week |
8.32% |
3.03% |
| 12 Week |
0.00% |
-7.55% |
| Year To Date |
13.77% |
4.27% |
|
|
|
|
| |
|
|
| |
| • General Corporate Information |
Officers
David M. Sedgwick - President and Chief Executive Officer
Derek Bunker - Chief Financial Officer and Treasurer
Lauren Beale - Chief Accounting Officer
Diana Laing - Director
Anne Olson - Director
|
|
Peer Information
CareTrust REIT, Inc. (ARE)
CareTrust REIT, Inc. (CUZ)
CareTrust REIT, Inc. (FUR)
CareTrust REIT, Inc. (NNN)
CareTrust REIT, Inc. (FCH)
CareTrust REIT, Inc. (CTO)
|
|
Industry / Sector / Ticker Info
Analyst Coverage: No
Industry Group: REIT-EQTY TRUST -OTHER
Sector: Finance
CUSIP: 14174T107
SIC: 6798
|
|
Fiscal Year
Fiscal Year End: December
Last Reported Quarter: 03/01/26
Next Expected EPS Date: 08/05/26
|
|
Share - Related Items
Shares Outstanding: 236.24
Most Recent Split Date: (:1)
Beta: 0.76
Market Capitalization: $9,718.91 (millions)
|
|
|
|
|
| |
| • EPS Information |
• Dividend Information |
| Analyst Coverage: No |
Dividend Yield: 3.79% |
| Current Fiscal Quarter EPS Consensus Estimate: $0.49 |
Indicated Annual Dividend: $1.56 |
| Current Fiscal Year EPS Consensus Estimate: $2.00 |
Payout Ratio: 0.73 |
| Number of Estimates in the Fiscal Year Consensus: 1.00 |
Change In Payout Ratio: -0.04 |
| Estmated Long-Term EPS Growth Rate: 7.56% |
Last Dividend Paid: NA - $0.00 |
| Next EPS Report Date: 08/05/26 |
|
|
|
| |