| Zacks Company Profile for DHT Holdings, Inc. (DHT : NYSE) |
|
|
| |
| • Company Description |
| DHT MARITIME INC., formerly Double Hull Tankers, Inc. operates a fleet of double-hull crude oil tankers on international routes. DHT's modern fleet consists of three Very Large Crude Carriers, two Suezmax tankers and four Aframax tankers. DHT intends to pursue a strategy of providing shareholders with a stable and visible distribution and also position the Company to use its incremental cash flow to fund future growth opportunities.
Number of Employees: 737 |
|
|
| |
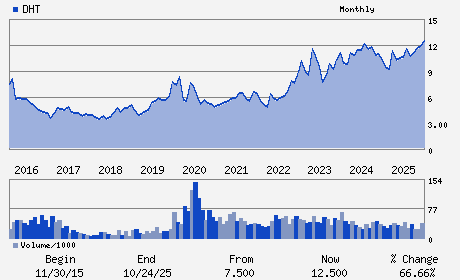
| • Price / Volume Information |
| Yesterday's Closing Price: $17.38 |
Daily Weekly Monthly
 |
| 20 Day Moving Average: 2,915,357 shares |
| Shares Outstanding: 161.04 (millions) |
| Market Capitalization: $2,798.91 (millions) |
| Beta: -0.08 |
| 52 Week High: $20.55 |
| 52 Week Low: $10.61 |
| Short Interest Ratio: |
| |
% Price Change |
% Price Change Relative to S&P 500 |
| 4 Week |
-2.30% |
-7.08% |
| 12 Week |
-9.34% |
-16.19% |
| Year To Date |
42.34% |
33.73% |
|
|
|
|
| |
| • Address & Contact Information |
| Street Address |
Phone / Fax |
Email Address |
Web URL |
CLARENDON HOUSE 2 CHURCH STREET
-
HAMILTON,D0 HM 11
BMU |
ph: 1-441-299-4912
fax: 441-298-7800 |
wf@dhtankers.com |
http://www.dhtankers.com |
|
|
| |
| • General Corporate Information |
Officers
Svein Moxnes Harfjeld - President and Chief Executive Officer
Erik A. Lind - Chairman
Laila Cecilie Halvorsen - Chief Financial Officer
Sophie Rossini - Director
Jeremy Kramer - Director
|
|
Peer Information
DHT Holdings, Inc. (BHODQ)
DHT Holdings, Inc. (GNK.2)
DHT Holdings, Inc. (NPTOY)
DHT Holdings, Inc. (SCRB)
DHT Holdings, Inc. (SHWK)
DHT Holdings, Inc. (ACLNF)
|
|
Industry / Sector / Ticker Info
Analyst Coverage: No
Industry Group: TRANS-SHIP
Sector: Transportation
CUSIP: Y2065G121
SIC: 4412
|
|
Fiscal Year
Fiscal Year End: December
Last Reported Quarter: 03/01/26
Next Expected EPS Date: 08/05/26
|
|
Share - Related Items
Shares Outstanding: 161.04
Most Recent Split Date: 7.00 (0.08:1)
Beta: -0.08
Market Capitalization: $2,798.91 (millions)
|
|
|
|
|
| |
| • EPS Information |
• Dividend Information |
| Analyst Coverage: No |
Dividend Yield: 14.73% |
| Current Fiscal Quarter EPS Consensus Estimate: $ |
Indicated Annual Dividend: $2.56 |
| Current Fiscal Year EPS Consensus Estimate: $ |
Payout Ratio: 0.85 |
| Number of Estimates in the Fiscal Year Consensus: |
Change In Payout Ratio: -0.05 |
| Estmated Long-Term EPS Growth Rate: % |
Last Dividend Paid: 02/19/2026 - $0.41 |
| Next EPS Report Date: 08/05/26 |
|
|
|
| |