| Zacks Company Profile for Delixy Holdings Limited (DLXY : NSDQ) |
|
|
| |
| • Company Description |
| Delixy Holdings Limited is a company principally engaged in the trading of oil-related products, including crude oil and oil-based products such as fuel oils, motor gasoline, additives, gas condensate, base oils, asphalt, petrochemicals and naphtha. Delixy Holdings Limited is based in Singapore.
Number of Employees: 11 |
|
|
| |
| • Price / Volume Information |
| Yesterday's Closing Price: $0.47 |
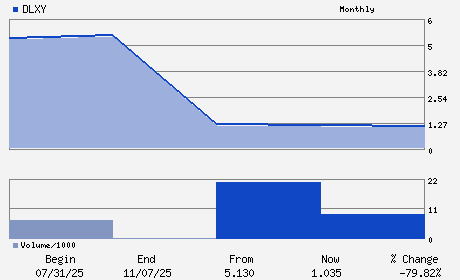
Daily Weekly Monthly
 |
| 20 Day Moving Average: 149,660 shares |
| Shares Outstanding: 16.35 (millions) |
| Market Capitalization: $7.72 (millions) |
| Beta: |
| 52 Week High: $7.16 |
| 52 Week Low: $0.45 |
| Short Interest Ratio: |
| |
% Price Change |
% Price Change Relative to S&P 500 |
| 4 Week |
-38.51% |
-41.51% |
| 12 Week |
-52.80% |
-56.37% |
| Year To Date |
-46.58% |
-50.99% |
|
|
|
|
| |
| • Address & Contact Information |
| Street Address |
Phone / Fax |
Email Address |
Web URL |
883 NORTH BRIGE ROAD
-
SINGAPORE,U0 198785
SGP |
ph: 65-6337-0260
fax: - |
None |
None |
|
|
| |
| • General Corporate Information |
Officers
Xie, Dongjian - Chief Executive Officer; Executive Chairman and Ex
Yao, Yuan - Executive Director and Chief Operating Officer
Yen Chong Yin Lai - Chief Financial Officer
Lay, Shi Wei - Independent Director
Yap, Beng Tat, Richard - Independent Director
|
|
Peer Information
Delixy Holdings Limited (BP)
Delixy Holdings Limited (AKRBY)
Delixy Holdings Limited (XOM)
Delixy Holdings Limited (T.HOC)
Delixy Holdings Limited (LUKOY)
Delixy Holdings Limited (PTRCY)
|
|
Industry / Sector / Ticker Info
Analyst Coverage: No
Industry Group: OIL-INTL INTGD
Sector: Oils/Energy
CUSIP: G2703G103
SIC: 5172
|
|
Fiscal Year
Fiscal Year End: December
Last Reported Quarter: -
Next Expected EPS Date: 07/30/26
|
|
Share - Related Items
Shares Outstanding: 16.35
Most Recent Split Date: (:1)
Beta:
Market Capitalization: $7.72 (millions)
|
|
|
|
|
| |
| • EPS Information |
• Dividend Information |
| Analyst Coverage: No |
Dividend Yield: 0.00% |
| Current Fiscal Quarter EPS Consensus Estimate: $ |
Indicated Annual Dividend: $0.00 |
| Current Fiscal Year EPS Consensus Estimate: $ |
Payout Ratio: |
| Number of Estimates in the Fiscal Year Consensus: |
Change In Payout Ratio: |
| Estmated Long-Term EPS Growth Rate: % |
Last Dividend Paid: NA - $0.00 |
| Next EPS Report Date: 07/30/26 |
|
|
|
| |