| Zacks Company Profile for DNB Bank ASA (DNBBY : OTC) |
|
|
| |
| • Company Description |
| DNB ASA is a commercial bank which provide banking products and services to retail and corporate customers primarily in Norway and internationally. The company offers savings and investment products, loans, investment banking advisory, financing services, insurance products, foreign exchange, cash management, payments and pension services as well as cards, advisory and real estate broking services. DNB ASA is headquartered in Oslo, Norway.
Number of Employees: 11,515 |
|
|
| |
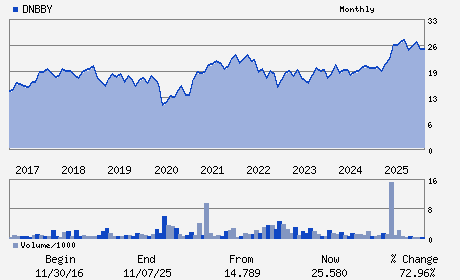
| • Price / Volume Information |
| Yesterday's Closing Price: $31.39 |
Daily Weekly Monthly
 |
| 20 Day Moving Average: 73,491 shares |
| Shares Outstanding: 1,550.36 (millions) |
| Market Capitalization: $48,665.96 (millions) |
| Beta: 0.64 |
| 52 Week High: $33.81 |
| 52 Week Low: $24.77 |
| Short Interest Ratio: |
| |
% Price Change |
% Price Change Relative to S&P 500 |
| 4 Week |
5.04% |
-0.09% |
| 12 Week |
-1.07% |
-8.55% |
| Year To Date |
12.71% |
4.22% |
|
|
|
|
| |
|
|
| |
| • General Corporate Information |
Officers
Kjerstin R. Braathen - Chief Executive Officer
Olaug Svarva - Chairman
Jens Petter Olsen - Vice-Chairman
Ida Lerner - Chief Financial Officer
Gro Bakstad - Director
|
|
Peer Information
DNB Bank ASA (BKAU)
DNB Bank ASA (BKEAY)
DNB Bank ASA (BKNIY)
DNB Bank ASA (BKJAY)
DNB Bank ASA (ABNYY)
DNB Bank ASA (BNSTY)
|
|
Industry / Sector / Ticker Info
Analyst Coverage: No
Industry Group: BANKS-FOREIGN
Sector: Finance
CUSIP: 23341C103
SIC: 6029
|
|
Fiscal Year
Fiscal Year End: December
Last Reported Quarter: 03/01/26
Next Expected EPS Date: 07/10/26
|
|
Share - Related Items
Shares Outstanding: 1,550.36
Most Recent Split Date: 6.00 (10.00:1)
Beta: 0.64
Market Capitalization: $48,665.96 (millions)
|
|
|
|
|
| |
| • EPS Information |
• Dividend Information |
| Analyst Coverage: No |
Dividend Yield: 4.52% |
| Current Fiscal Quarter EPS Consensus Estimate: $ |
Indicated Annual Dividend: $1.42 |
| Current Fiscal Year EPS Consensus Estimate: $2.89 |
Payout Ratio: 0.43 |
| Number of Estimates in the Fiscal Year Consensus: 2.00 |
Change In Payout Ratio: -0.06 |
| Estmated Long-Term EPS Growth Rate: % |
Last Dividend Paid: 04/23/2026 - $1.42 |
| Next EPS Report Date: 07/10/26 |
|
|
|
| |