| Zacks Company Profile for BRP Inc. (DOO : NSDQ) |
|
|
| |
| • Company Description |
| BRP Inc. designs, develops, manufactures and distributes recreational vehicles. The Company offers watercrafts, sport boats, snowmobiles, pontoons, marine propulsion systems and all-terrain and utility vehicles, as well as engines for karts, motorcycles and recreational aircrafts. BRP Inc. is headquartered in Valcourt, Canada.
Number of Employees: 17,000 |
|
|
| |
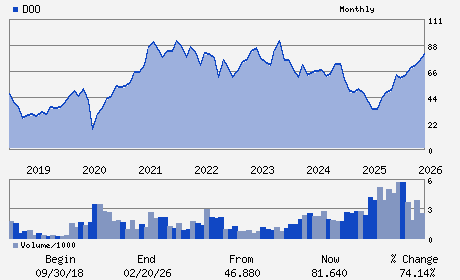
| • Price / Volume Information |
| Yesterday's Closing Price: $55.38 |
Daily Weekly Monthly
 |
| 20 Day Moving Average: 375,164 shares |
| Shares Outstanding: 73.74 (millions) |
| Market Capitalization: $4,083.61 (millions) |
| Beta: 0.90 |
| 52 Week High: $81.89 |
| 52 Week Low: $35.02 |
| Short Interest Ratio: |
| |
% Price Change |
% Price Change Relative to S&P 500 |
| 4 Week |
-1.02% |
-5.85% |
| 12 Week |
-28.60% |
-33.99% |
| Year To Date |
-21.74% |
-28.81% |
|
|
|
|
| |
|
|
| |
| • General Corporate Information |
Officers
Jose Boisjoli - President and Chief Executive Officer
Sebastien Martel - Chief Financial Officer
Michael Hanley - Director
Daniel J. O`neill - Director
Louis Laporte - Director
|
|
Peer Information
BRP Inc. (M.BUD)
BRP Inc. (DCNAQ)
BRP Inc. (CGUL)
BRP Inc. (DAN)
BRP Inc. (CTTAY)
BRP Inc. (M.DEC)
|
|
Industry / Sector / Ticker Info
Analyst Coverage: No
Industry Group: AUTO/TRUCK-ORIG
Sector: Auto/Tires/Trucks
CUSIP: 05577W200
SIC: 3790
|
|
Fiscal Year
Fiscal Year End: January
Last Reported Quarter: 01/01/26
Next Expected EPS Date: 05/28/26
|
|
Share - Related Items
Shares Outstanding: 73.74
Most Recent Split Date: (:1)
Beta: 0.90
Market Capitalization: $4,083.61 (millions)
|
|
|
|
|
| |
| • EPS Information |
• Dividend Information |
| Analyst Coverage: No |
Dividend Yield: 1.30% |
| Current Fiscal Quarter EPS Consensus Estimate: $-0.03 |
Indicated Annual Dividend: $0.72 |
| Current Fiscal Year EPS Consensus Estimate: $2.09 |
Payout Ratio: 0.17 |
| Number of Estimates in the Fiscal Year Consensus: 6.00 |
Change In Payout Ratio: 0.06 |
| Estmated Long-Term EPS Growth Rate: % |
Last Dividend Paid: 04/10/2026 - $0.18 |
| Next EPS Report Date: 05/28/26 |
|
|
|
| |