| Zacks Company Profile for EMCOR Group, Inc. (EME : NYSE) |
|
|
| |
| • Company Description |
| EMCOR Group is one of the leading providers of mechanical and electrical construction, industrial and energy infrastructure, as well as building services for a diverse range of businesses. The company serves commercial, industrial, utility and institutional clients.
Number of Employees: 44,000 |
|
|
| |
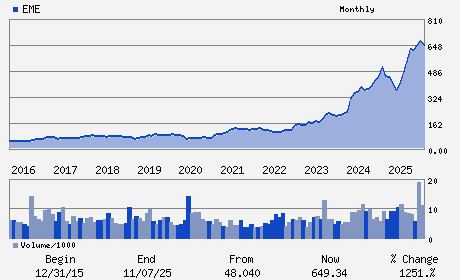
| • Price / Volume Information |
| Yesterday's Closing Price: $848.91 |
Daily Weekly Monthly
 |
| 20 Day Moving Average: 381,290 shares |
| Shares Outstanding: 44.44 (millions) |
| Market Capitalization: $37,725.56 (millions) |
| Beta: 1.17 |
| 52 Week High: $951.96 |
| 52 Week Low: $450.68 |
| Short Interest Ratio: |
| |
% Price Change |
% Price Change Relative to S&P 500 |
| 4 Week |
-2.77% |
-7.52% |
| 12 Week |
13.77% |
5.17% |
| Year To Date |
38.76% |
27.62% |
|
|
|
|
| |
|
|
| |
| • General Corporate Information |
Officers
Anthony J. Guzzi - Chief Executive Officer;Chairman; President
Jason R. Nalbandian - Senior Vice President; Chief Financial Officer a
John W. Altmeyer - Director
Amy E. Dahl - Director
Ronald L. Johnson - Director
|
|
Peer Information
EMCOR Group, Inc. (DBCOQ)
EMCOR Group, Inc. (PHOE)
EMCOR Group, Inc. (UNTKQ)
EMCOR Group, Inc. (MTZ)
EMCOR Group, Inc. (CBI)
EMCOR Group, Inc. (GMDBY)
|
|
Industry / Sector / Ticker Info
Analyst Coverage: No
Industry Group: BLDG-HEAVY CNST
Sector: Construction
CUSIP: 29084Q100
SIC: 1731
|
|
Fiscal Year
Fiscal Year End: December
Last Reported Quarter: 03/01/26
Next Expected EPS Date: 07/30/26
|
|
Share - Related Items
Shares Outstanding: 44.44
Most Recent Split Date: 7.00 (2.00:1)
Beta: 1.17
Market Capitalization: $37,725.56 (millions)
|
|
|
|
|
| |
| • EPS Information |
• Dividend Information |
| Analyst Coverage: No |
Dividend Yield: 0.19% |
| Current Fiscal Quarter EPS Consensus Estimate: $7.02 |
Indicated Annual Dividend: $1.60 |
| Current Fiscal Year EPS Consensus Estimate: $28.67 |
Payout Ratio: 0.06 |
| Number of Estimates in the Fiscal Year Consensus: 4.00 |
Change In Payout Ratio: 0.00 |
| Estmated Long-Term EPS Growth Rate: % |
Last Dividend Paid: 04/16/2026 - $0.40 |
| Next EPS Report Date: 07/30/26 |
|
|
|
| |