| Zacks Company Profile for Enanta Pharmaceuticals, Inc. (ENTA : NSDQ) |
|
|
| |
| • Company Description |
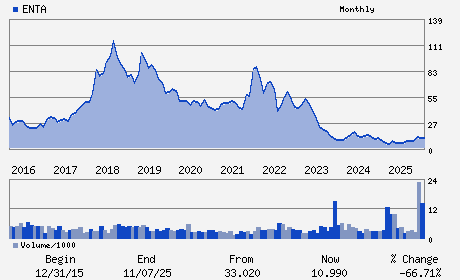
| Enanta Pharmaceuticals, Inc. is a biotechnology company. It engages in the research and development of molecule drugs for the treatment of infectious diseases such as hepatitis C virus, respiratory tract infections, intravenous and oral treatments. Enanta Pharmaceuticals, Inc. is headquartered in Watertown, Massachusetts.
Number of Employees: 120 |
|
|
| |
| • Price / Volume Information |
| Yesterday's Closing Price: $13.95 |
Daily Weekly Monthly
 |
| 20 Day Moving Average: 202,214 shares |
| Shares Outstanding: 29.08 (millions) |
| Market Capitalization: $405.64 (millions) |
| Beta: 1.01 |
| 52 Week High: $17.15 |
| 52 Week Low: $5.55 |
| Short Interest Ratio: |
| |
% Price Change |
% Price Change Relative to S&P 500 |
| 4 Week |
4.49% |
-0.61% |
| 12 Week |
-3.19% |
-10.51% |
| Year To Date |
-11.54% |
-19.37% |
|
|
|
|
| |
| • Address & Contact Information |
| Street Address |
Phone / Fax |
Email Address |
Web URL |
4 KINGSBURY AVENUE
-
WATERTOWN,MA 02472
USA |
ph: 617-607-0800
fax: 617-607-0530 |
ir@enanta.com |
http://www.enanta.com |
|
|
| |
| • General Corporate Information |
Officers
Jay R. Luly - President and Chief Executive Officer and Director
Harry R. Trout - Vice President; Finance
Bruce L.A. Carter - Director
Mark G. Foletta - Director
Yujiro S. Hata - Director
|
|
Peer Information
Enanta Pharmaceuticals, Inc. (CORR.)
Enanta Pharmaceuticals, Inc. (RSPI)
Enanta Pharmaceuticals, Inc. (CGXP)
Enanta Pharmaceuticals, Inc. (BGEN)
Enanta Pharmaceuticals, Inc. (GTBP)
Enanta Pharmaceuticals, Inc. (RGRX)
|
|
Industry / Sector / Ticker Info
Analyst Coverage: No
Industry Group: MED-BIOMED/GENE
Sector: Medical
CUSIP: 29251M106
SIC: 2834
|
|
Fiscal Year
Fiscal Year End: September
Last Reported Quarter: 03/01/26
Next Expected EPS Date: 08/10/26
|
|
Share - Related Items
Shares Outstanding: 29.08
Most Recent Split Date: (:1)
Beta: 1.01
Market Capitalization: $405.64 (millions)
|
|
|
|
|
| |
| • EPS Information |
• Dividend Information |
| Analyst Coverage: No |
Dividend Yield: 0.00% |
| Current Fiscal Quarter EPS Consensus Estimate: $-0.42 |
Indicated Annual Dividend: $0.00 |
| Current Fiscal Year EPS Consensus Estimate: $-2.01 |
Payout Ratio: |
| Number of Estimates in the Fiscal Year Consensus: 3.00 |
Change In Payout Ratio: |
| Estmated Long-Term EPS Growth Rate: % |
Last Dividend Paid: NA - $0.00 |
| Next EPS Report Date: 08/10/26 |
|
|
|
| |