| Zacks Company Profile for Evolus, Inc. (EOLS : NSDQ) |
|
|
| |
| • Company Description |
| Evolus, Inc. is a medical aesthetics company. It focuses on providing physicians and patients in aesthetic procedures and treatments. The company focuses on the self-pay aesthetic market and its lead product candidate, DWP-450, is an injectable 900 kDa purified botulinum toxin type A complex. Evolus, Inc. is based in Irvine, California.
Number of Employees: 334 |
|
|
| |
| • Price / Volume Information |
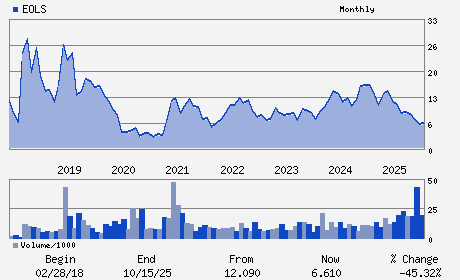
| Yesterday's Closing Price: $6.09 |
Daily Weekly Monthly
 |
| 20 Day Moving Average: 956,208 shares |
| Shares Outstanding: 65.86 (millions) |
| Market Capitalization: $401.06 (millions) |
| Beta: 1.28 |
| 52 Week High: $10.62 |
| 52 Week Low: $3.86 |
| Short Interest Ratio: |
| |
% Price Change |
% Price Change Relative to S&P 500 |
| 4 Week |
14.69% |
9.09% |
| 12 Week |
35.64% |
25.39% |
| Year To Date |
-8.42% |
-10.83% |
|
|
|
|
| |
| • Address & Contact Information |
| Street Address |
Phone / Fax |
Email Address |
Web URL |
520 Newport Center Dr. Suite 1200
-
Newport Beach,CA 92660
USA |
ph: 949-284-4555
fax: - |
ir@evolus.com |
http://www.evolus.com |
|
|
| |
| • General Corporate Information |
Officers
David Moatazedi - President and Chief Executive Officer
Vikram Malik - Chairman
Tatjana Mitchell - Chief Financial Officer
David Gill - Director
Karah Parschauer - Director
|
|
Peer Information
Evolus, Inc. (BJCT)
Evolus, Inc. (CADMQ)
Evolus, Inc. (APNO)
Evolus, Inc. (UPDC)
Evolus, Inc. (IMTIQ)
Evolus, Inc. (CYGN)
|
|
Industry / Sector / Ticker Info
Analyst Coverage: No
Industry Group: MED PRODUCTS
Sector: Medical
CUSIP: 30052C107
SIC: 2834
|
|
Fiscal Year
Fiscal Year End: December
Last Reported Quarter: 03/01/26
Next Expected EPS Date: 08/04/26
|
|
Share - Related Items
Shares Outstanding: 65.86
Most Recent Split Date: (:1)
Beta: 1.28
Market Capitalization: $401.06 (millions)
|
|
|
|
|
| |
| • EPS Information |
• Dividend Information |
| Analyst Coverage: No |
Dividend Yield: 0.00% |
| Current Fiscal Quarter EPS Consensus Estimate: $-0.11 |
Indicated Annual Dividend: $0.00 |
| Current Fiscal Year EPS Consensus Estimate: $-0.41 |
Payout Ratio: |
| Number of Estimates in the Fiscal Year Consensus: 3.00 |
Change In Payout Ratio: |
| Estmated Long-Term EPS Growth Rate: % |
Last Dividend Paid: NA - $0.00 |
| Next EPS Report Date: 08/04/26 |
|
|
|
| |