| Zacks Company Profile for Equitable Holdings, Inc. (EQH : NYSE) |
|
|
| |
| • Company Description |
| Equitable Holdings, Inc. is a financial services holding company comprised of two franchises, Equitable and AllianceBernstein. Equitable provides advice, protection and retirement strategies to individuals, families and small businesses. AllianceBernstein is a global investment management firm that offers research and diversified investment services to institutional investors, individuals and private wealth clients in major world markets.
Number of Employees: 8,000 |
|
|
| |
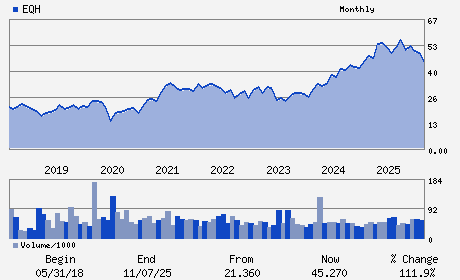
| • Price / Volume Information |
| Yesterday's Closing Price: $42.58 |
Daily Weekly Monthly
 |
| 20 Day Moving Average: 3,887,401 shares |
| Shares Outstanding: 281.52 (millions) |
| Market Capitalization: $11,987.08 (millions) |
| Beta: 1.13 |
| 52 Week High: $56.57 |
| 52 Week Low: $35.20 |
| Short Interest Ratio: |
| |
% Price Change |
% Price Change Relative to S&P 500 |
| 4 Week |
2.36% |
-2.64% |
| 12 Week |
1.57% |
-6.10% |
| Year To Date |
-10.64% |
-17.96% |
|
|
|
|
| |
|
|
| |
| • General Corporate Information |
Officers
Mark Pearson - President;Chief Executive Officer and Director
Joan M. Lamm-Tennant - Chairman
Robin M. Raju - Chief Financial Officer
William Eckert - Chief Accounting Officer
Francis Hondal - Director
|
|
Peer Information
Equitable Holdings, Inc. (RDN)
Equitable Holdings, Inc. (AIG)
Equitable Holdings, Inc. (ACGI)
Equitable Holdings, Inc. (TXSC)
Equitable Holdings, Inc. (PTVCB)
Equitable Holdings, Inc. (PTVCA)
|
|
Industry / Sector / Ticker Info
Analyst Coverage: No
Industry Group: INS-MULTI LINE
Sector: Finance
CUSIP: 29452E101
SIC: 6411
|
|
Fiscal Year
Fiscal Year End: December
Last Reported Quarter: 03/01/26
Next Expected EPS Date: 08/04/26
|
|
Share - Related Items
Shares Outstanding: 281.52
Most Recent Split Date: (:1)
Beta: 1.13
Market Capitalization: $11,987.08 (millions)
|
|
|
|
|
| |
| • EPS Information |
• Dividend Information |
| Analyst Coverage: No |
Dividend Yield: 2.54% |
| Current Fiscal Quarter EPS Consensus Estimate: $1.73 |
Indicated Annual Dividend: $1.08 |
| Current Fiscal Year EPS Consensus Estimate: $7.08 |
Payout Ratio: 0.18 |
| Number of Estimates in the Fiscal Year Consensus: 6.00 |
Change In Payout Ratio: 0.02 |
| Estmated Long-Term EPS Growth Rate: 13.03% |
Last Dividend Paid: 03/04/2026 - $0.27 |
| Next EPS Report Date: 08/04/26 |
|
|
|
| |