| Zacks Company Profile for Exp World Holdings, Inc. (EXPI : NSDQ) |
|
|
| |
| • Company Description |
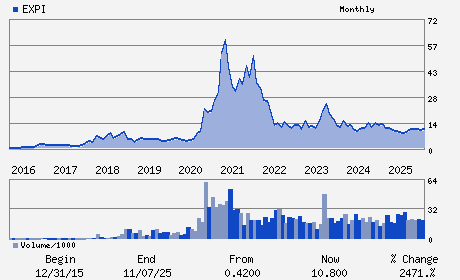
| eXp World Holdings, Inc. provides cloud-based real estate brokerage services primarily in the United states and Canada. The company facilitates buyers to search real-time property listings and sellers to list their properties through its Website and provides buyers and sellers access to a network of professional, consumer-centric agents and brokers. eXp World Holdings, Inc., formerly known as eXp Realty International Corporation, is based in Bellingham, Washington.
Number of Employees: 2,001 |
|
|
| |
| • Price / Volume Information |
| Yesterday's Closing Price: $7.32 |
Daily Weekly Monthly
 |
| 20 Day Moving Average: 1,043,930 shares |
| Shares Outstanding: 161.89 (millions) |
| Market Capitalization: $1,185.06 (millions) |
| Beta: 2.12 |
| 52 Week High: $12.23 |
| 52 Week Low: $6.90 |
| Short Interest Ratio: |
| |
% Price Change |
% Price Change Relative to S&P 500 |
| 4 Week |
-18.94% |
-18.23% |
| 12 Week |
-34.17% |
-34.67% |
| Year To Date |
-19.12% |
-19.86% |
|
|
|
|
| |
|
|
| |
| • General Corporate Information |
Officers
Glenn Sanford - Chief Executive Officer and Chairman
Jesse Hill - Chief Financial Officer
James Bramble - Chief Legal Counsel and Corporate Secretary
Randall Miles - Director
Dan Cahir - Director
|
|
Peer Information
Exp World Holdings, Inc. (ARL)
Exp World Holdings, Inc. (FNDOY)
Exp World Holdings, Inc. (AOXY)
Exp World Holdings, Inc. (HLDCY)
Exp World Holdings, Inc. (IOR)
Exp World Holdings, Inc. (GYRO)
|
|
Industry / Sector / Ticker Info
Analyst Coverage: No
Industry Group: REAL ESTATE OPS
Sector: Finance
CUSIP: 30212W100
SIC: 6531
|
|
Fiscal Year
Fiscal Year End: December
Last Reported Quarter: 12/01/25
Next Expected EPS Date: 05/05/26
|
|
Share - Related Items
Shares Outstanding: 161.89
Most Recent Split Date: 2.00 (2.00:1)
Beta: 2.12
Market Capitalization: $1,185.06 (millions)
|
|
|
|
|
| |
| • EPS Information |
• Dividend Information |
| Analyst Coverage: No |
Dividend Yield: 2.73% |
| Current Fiscal Quarter EPS Consensus Estimate: $-0.05 |
Indicated Annual Dividend: $0.20 |
| Current Fiscal Year EPS Consensus Estimate: $0.06 |
Payout Ratio: |
| Number of Estimates in the Fiscal Year Consensus: 1.00 |
Change In Payout Ratio: |
| Estmated Long-Term EPS Growth Rate: % |
Last Dividend Paid: NA - $0.00 |
| Next EPS Report Date: 05/05/26 |
|
|
|
| |