| Zacks Company Profile for EZCORP, Inc. (EZPW : NSDQ) |
|
|
| |
| • Company Description |
| Ezcorp Inc. is engaged in establishing, acquiring, and operating pawnshops which function as convenient sources of consumer credit and as value-oriented specialty retailers of primarily previously owned merchandise. Through its lending function, the company makes relatively small, non-recourse loans secured by pledges of tangible personal property. The company contracts for a pawn service charge to compensate it for each pawn loan.
Number of Employees: 8,500 |
|
|
| |
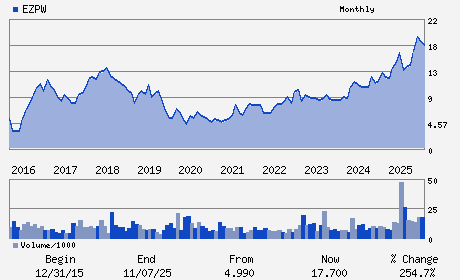
| • Price / Volume Information |
| Yesterday's Closing Price: $33.79 |
Daily Weekly Monthly
 |
| 20 Day Moving Average: 733,701 shares |
| Shares Outstanding: 61.54 (millions) |
| Market Capitalization: $2,079.30 (millions) |
| Beta: 0.65 |
| 52 Week High: $37.13 |
| 52 Week Low: $12.85 |
| Short Interest Ratio: |
| |
% Price Change |
% Price Change Relative to S&P 500 |
| 4 Week |
6.49% |
1.29% |
| 12 Week |
27.99% |
18.32% |
| Year To Date |
74.00% |
58.31% |
|
|
|
|
| |
|
|
| |
| • General Corporate Information |
Officers
Lachlan P. Given - Chief Executive Officer and Director
Phillip E. Cohen - Executive Chairman
Timothy K. Jugmans - Chief Financial Officer
Michael Croney - Chief Accounting Officer
Matthew W. Appel - Director
|
|
Peer Information
EZCORP, Inc. (EZPW)
EZCORP, Inc. (FPLPY)
EZCORP, Inc. (FMACQ)
EZCORP, Inc. (ASFI)
EZCORP, Inc. (ACAR.)
EZCORP, Inc. (HI.)
|
|
Industry / Sector / Ticker Info
Analyst Coverage: No
Industry Group: FIN-CONS LOANS
Sector: Finance
CUSIP: 302301106
SIC: 5900
|
|
Fiscal Year
Fiscal Year End: September
Last Reported Quarter: 03/01/26
Next Expected EPS Date: 07/29/26
|
|
Share - Related Items
Shares Outstanding: 61.54
Most Recent Split Date: 12.00 (3.00:1)
Beta: 0.65
Market Capitalization: $2,079.30 (millions)
|
|
|
|
|
| |
| • EPS Information |
• Dividend Information |
| Analyst Coverage: No |
Dividend Yield: 0.00% |
| Current Fiscal Quarter EPS Consensus Estimate: $0.39 |
Indicated Annual Dividend: $0.00 |
| Current Fiscal Year EPS Consensus Estimate: $2.00 |
Payout Ratio: 0.00 |
| Number of Estimates in the Fiscal Year Consensus: 1.00 |
Change In Payout Ratio: 0.00 |
| Estmated Long-Term EPS Growth Rate: % |
Last Dividend Paid: NA - $0.00 |
| Next EPS Report Date: 07/29/26 |
|
|
|
| |