| Zacks Company Profile for Flowers Foods, Inc. (FLO : NYSE) |
|
|
| |
| • Company Description |
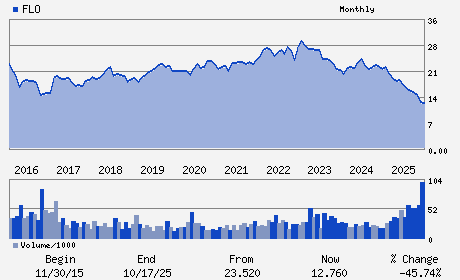
| Flowers Foods, Inc. produces packaged bakery foods in the United States. The company specializes in baked food products as well as produces a wide range of breads, buns, rolls, snack cakes and tortillas. Some of the most popular brands of the company include: Nature's Own, Wonder, Dave's Killer Bread and Tastykake.
Number of Employees: 10,300 |
|
|
| |
| • Price / Volume Information |
| Yesterday's Closing Price: $7.94 |
Daily Weekly Monthly
 |
| 20 Day Moving Average: 9,433,026 shares |
| Shares Outstanding: 211.86 (millions) |
| Market Capitalization: $1,682.14 (millions) |
| Beta: 0.46 |
| 52 Week High: $17.24 |
| 52 Week Low: $6.80 |
| Short Interest Ratio: |
| |
% Price Change |
% Price Change Relative to S&P 500 |
| 4 Week |
-9.57% |
-13.99% |
| 12 Week |
-19.88% |
-25.93% |
| Year To Date |
-27.02% |
-40.76% |
|
|
|
|
| |
| • Address & Contact Information |
| Street Address |
Phone / Fax |
Email Address |
Web URL |
1919 FLOWERS CIRCLE
-
THOMASVILLE,GA 31757
USA |
ph: 229-226-9110
fax: 229-225-3816 |
None |
http://www.flowersfoods.com |
|
|
| |
| • General Corporate Information |
Officers
A. Ryals McMullian - Chairman and Chief Executive Officer
D. Anthony Scaglione - Chief Financial Officer
George E. Deese - Director
Rhonda O. Gass - Director
Brigitte H. King - Director
|
|
Peer Information
Flowers Foods, Inc. (CDSCY)
Flowers Foods, Inc. (HDNHY)
Flowers Foods, Inc. (CPB)
Flowers Foods, Inc. (AMNF)
Flowers Foods, Inc. (GMFIY)
Flowers Foods, Inc. (BRID)
|
|
Industry / Sector / Ticker Info
Analyst Coverage: No
Industry Group: FOOD-MISC/DIVERSIFIED
Sector: Consumer Staples
CUSIP: 343498101
SIC: 2000
|
|
Fiscal Year
Fiscal Year End: December
Last Reported Quarter: 03/01/26
Next Expected EPS Date: 08/21/26
|
|
Share - Related Items
Shares Outstanding: 211.86
Most Recent Split Date: 6.00 (1.50:1)
Beta: 0.46
Market Capitalization: $1,682.14 (millions)
|
|
|
|
|
| |
| • EPS Information |
• Dividend Information |
| Analyst Coverage: No |
Dividend Yield: 12.47% |
| Current Fiscal Quarter EPS Consensus Estimate: $0.25 |
Indicated Annual Dividend: $0.99 |
| Current Fiscal Year EPS Consensus Estimate: $0.87 |
Payout Ratio: 0.90 |
| Number of Estimates in the Fiscal Year Consensus: 2.00 |
Change In Payout Ratio: 0.16 |
| Estmated Long-Term EPS Growth Rate: % |
Last Dividend Paid: 03/06/2026 - $0.25 |
| Next EPS Report Date: 08/21/26 |
|
|
|
| |