| Zacks Company Profile for Firefly Aerospace, Inc. (FLY : NSDQ) |
|
|
| |
| • Company Description |
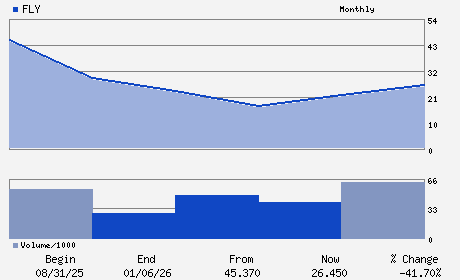
| Firefly Aerospace is a space and defense technology company which enables government and commercial customers to launch, land and operate in space. Firefly Aerospace is based in CEDAR PARK, Texas.
Number of Employees: 1,409 |
|
|
| |
| • Price / Volume Information |
| Yesterday's Closing Price: $49.50 |
Daily Weekly Monthly
 |
| 20 Day Moving Average: 6,231,989 shares |
| Shares Outstanding: 160.24 (millions) |
| Market Capitalization: $7,931.63 (millions) |
| Beta: |
| 52 Week High: $73.80 |
| 52 Week Low: $16.00 |
| Short Interest Ratio: |
| |
% Price Change |
% Price Change Relative to S&P 500 |
| 4 Week |
28.44% |
22.16% |
| 12 Week |
129.91% |
112.54% |
| Year To Date |
121.28% |
76.15% |
|
|
|
|
| |
|
|
| |
| • General Corporate Information |
Officers
Jason Kim - Chief Executive Officer and Director
Kirk Konert - Chairman of the Board
Ramon Sanchez - Chief Operating Officer
Darren Ma - Chief Financial Officer
Ryan Boland - Director
|
|
Peer Information
Firefly Aerospace, Inc. (BA)
Firefly Aerospace, Inc. (HOVR)
Firefly Aerospace, Inc. (HWM)
Firefly Aerospace, Inc. (LMT)
Firefly Aerospace, Inc. (TOD)
Firefly Aerospace, Inc. (TXT)
|
|
Industry / Sector / Ticker Info
Analyst Coverage: No
Industry Group: AEROSP/DEFENSE
Sector: Aerospace
CUSIP: 31816X106
SIC: 3760
|
|
Fiscal Year
Fiscal Year End: December
Last Reported Quarter: 03/01/26
Next Expected EPS Date: 09/28/26
|
|
Share - Related Items
Shares Outstanding: 160.24
Most Recent Split Date: (:1)
Beta:
Market Capitalization: $7,931.63 (millions)
|
|
|
|
|
| |
| • EPS Information |
• Dividend Information |
| Analyst Coverage: No |
Dividend Yield: 0.00% |
| Current Fiscal Quarter EPS Consensus Estimate: $-0.50 |
Indicated Annual Dividend: $0.00 |
| Current Fiscal Year EPS Consensus Estimate: $-1.81 |
Payout Ratio: |
| Number of Estimates in the Fiscal Year Consensus: 7.00 |
Change In Payout Ratio: |
| Estmated Long-Term EPS Growth Rate: % |
Last Dividend Paid: NA - $0.00 |
| Next EPS Report Date: 09/28/26 |
|
|
|
| |