| Zacks Company Profile for Grupo Mexico, S.A.B. de C.V. (GMBXF : OTC) |
|
|
| |
| • Company Description |
| Grupo M?xico, S.A.B. de C.V. engages in copper production, cargo transportation and infrastructure businesses. The company operates through Mining, Transportation and Infrastructure divisions. The Mining division explores for copper, silver, molybdenum, zinc, sulfuric acid, gold and selenium. The Transportation division offers railroad transportation services, including general and intermodal freight services by railroad; passenger transportation services and auxiliary terminal management and intra-terminal hauling services. The Infrastructure division offers land and ocean drilling services; and engineering services. Grupo M?xico, S.A.B. de C.V. is based in Mexico City, Mexico.
Number of Employees: |
|
|
| |
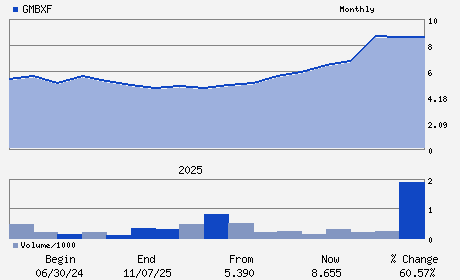
| • Price / Volume Information |
| Yesterday's Closing Price: $12.00 |
Daily Weekly Monthly
 |
| 20 Day Moving Average: 19,721 shares |
| Shares Outstanding: 7,785.00 (millions) |
| Market Capitalization: $93,420.00 (millions) |
| Beta: 1.07 |
| 52 Week High: $12.76 |
| 52 Week Low: $4.70 |
| Short Interest Ratio: |
| |
% Price Change |
% Price Change Relative to S&P 500 |
| 4 Week |
12.05% |
5.69% |
| 12 Week |
8.70% |
6.42% |
| Year To Date |
26.72% |
23.51% |
|
|
|
|
| |
| • Address & Contact Information |
| Street Address |
Phone / Fax |
Email Address |
Web URL |
-
-
-,- -
- |
ph: -
fax: - |
None |
None |
|
|
| |
| • General Corporate Information |
Officers
- - -
- - -
- - -
- - -
- - -
|
|
Peer Information
- (-)
- (-)
- (-)
- (-)
- (-)
- (-)
|
|
Industry / Sector / Ticker Info
Analyst Coverage: No
Industry Group: DIVERSIFIED OPS
Sector: Multi-Sector Conglomerates
CUSIP: P49538112
SIC: -
|
|
Fiscal Year
Fiscal Year End: December
Last Reported Quarter: -
Next Expected EPS Date: -
|
|
Share - Related Items
Shares Outstanding: 7,785.00
Most Recent Split Date: (:1)
Beta: 1.07
Market Capitalization: $93,420.00 (millions)
|
|
|
|
|
| |
| • EPS Information |
• Dividend Information |
| Analyst Coverage: No |
Dividend Yield: 0.00% |
| Current Fiscal Quarter EPS Consensus Estimate: $0.40 |
Indicated Annual Dividend: $0.00 |
| Current Fiscal Year EPS Consensus Estimate: $1.12 |
Payout Ratio: |
| Number of Estimates in the Fiscal Year Consensus: 2.00 |
Change In Payout Ratio: |
| Estmated Long-Term EPS Growth Rate: % |
Last Dividend Paid: NA - $0.00 |
| Next EPS Report Date: - |
|
|
|
| |