| Zacks Company Profile for Genworth Financial, Inc. (GNW : NYSE) |
|
|
| |
| • Company Description |
| Genworth Financial, through its principal insurance subsidiaries, offers mortgage and long-term care insurance products. Genworth Financial's legacy U.S. life insurance subsidiaries offer long-term care insurance and also manage in-force blocks of life insurance and annuity products that are no longer sold. Genworth Financial also has a start-up business whereby it offers fee-based services, advice, consulting and other aging-care products and services through CareScout.
Number of Employees: 3,100 |
|
|
| |
| • Price / Volume Information |
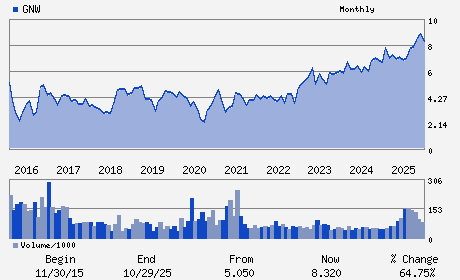
| Yesterday's Closing Price: $9.07 |
Daily Weekly Monthly
 |
| 20 Day Moving Average: 2,449,754 shares |
| Shares Outstanding: 383.01 (millions) |
| Market Capitalization: $3,473.89 (millions) |
| Beta: 0.89 |
| 52 Week High: $9.45 |
| 52 Week Low: $6.63 |
| Short Interest Ratio: |
| |
% Price Change |
% Price Change Relative to S&P 500 |
| 4 Week |
2.14% |
-2.85% |
| 12 Week |
4.86% |
-3.07% |
| Year To Date |
0.44% |
-5.82% |
|
|
|
|
| |
|
|
| |
| • General Corporate Information |
Officers
Thomas J. McInerney - Chief Executive Officer;President
Jerome T. Upton - Chief Financial Officer;Executive Vice President
Darren W. Woodell - Vice President and Controller
G. Kent Conrad - Director
Karen E. Dyson - Director
|
|
Peer Information
Genworth Financial, Inc. (AGC.)
Genworth Financial, Inc. (T.GWO)
Genworth Financial, Inc. (AMH.2)
Genworth Financial, Inc. (CSLI.)
Genworth Financial, Inc. (CIA)
Genworth Financial, Inc. (DFG)
|
|
Industry / Sector / Ticker Info
Analyst Coverage: No
Industry Group: INS-LIFE
Sector: Finance
CUSIP: 37247D106
SIC: 6311
|
|
Fiscal Year
Fiscal Year End: December
Last Reported Quarter: 03/01/26
Next Expected EPS Date: 07/29/26
|
|
Share - Related Items
Shares Outstanding: 383.01
Most Recent Split Date: (:1)
Beta: 0.89
Market Capitalization: $3,473.89 (millions)
|
|
|
|
|
| |
| • EPS Information |
• Dividend Information |
| Analyst Coverage: No |
Dividend Yield: 0.00% |
| Current Fiscal Quarter EPS Consensus Estimate: $ |
Indicated Annual Dividend: $0.00 |
| Current Fiscal Year EPS Consensus Estimate: $ |
Payout Ratio: 0.00 |
| Number of Estimates in the Fiscal Year Consensus: |
Change In Payout Ratio: 0.00 |
| Estmated Long-Term EPS Growth Rate: % |
Last Dividend Paid: NA - $0.00 |
| Next EPS Report Date: 07/29/26 |
|
|
|
| |