| Zacks Company Profile for GoHealth, Inc. (GOCO : NSDQ) |
|
|
| |
| • Company Description |
| GoHealth, Inc. provides health insurance marketplace. It offer health insurance policies, including Medicare advantage, Medicare supplement, Medicare prescription drug plans, Medicare special needs plans; individual and family, dental, vision and other related plans, through its platform. GoHealth, Inc. is based in Chicago, Illinois.
Number of Employees: 850 |
|
|
| |
| • Price / Volume Information |
| Yesterday's Closing Price: $0.65 |
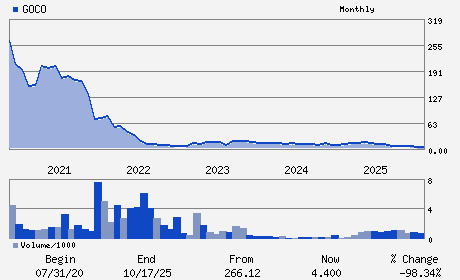
Daily Weekly Monthly
 |
| 20 Day Moving Average: 100,319 shares |
| Shares Outstanding: 28.85 (millions) |
| Market Capitalization: $18.88 (millions) |
| Beta: 1.33 |
| 52 Week High: $7.12 |
| 52 Week Low: $0.60 |
| Short Interest Ratio: |
| |
% Price Change |
% Price Change Relative to S&P 500 |
| 4 Week |
-45.45% |
-48.11% |
| 12 Week |
-54.54% |
-57.98% |
| Year To Date |
-69.55% |
-71.03% |
|
|
|
|
| |
| • Address & Contact Information |
| Street Address |
Phone / Fax |
Email Address |
Web URL |
222 W MERCHANDISE MART PLAZA SUITE 1750
-
CHICAGO,IL 60654
USA |
ph: 312-386-8200
fax: - |
ir@gohealth.com |
http://www.gohealth.com |
|
|
| |
| • General Corporate Information |
Officers
Vijay Kotte - Chief Executive Officer
Brandon Cruz - Co-Chairman
Clinton Jones - Co-Chairman
Michael Hargis - Chief Operating Officer
Brendan Shanahan - Chief Financial Officer
|
|
Peer Information
GoHealth, Inc. (AGC.)
GoHealth, Inc. (T.GWO)
GoHealth, Inc. (AMH.2)
GoHealth, Inc. (CSLI.)
GoHealth, Inc. (CIA)
GoHealth, Inc. (DFG)
|
|
Industry / Sector / Ticker Info
Analyst Coverage: No
Industry Group: INS-LIFE
Sector: Finance
CUSIP: 38046W204
SIC: 6411
|
|
Fiscal Year
Fiscal Year End: December
Last Reported Quarter: 12/01/25
Next Expected EPS Date: 05/26/26
|
|
Share - Related Items
Shares Outstanding: 28.85
Most Recent Split Date: 11.00 (0.07:1)
Beta: 1.33
Market Capitalization: $18.88 (millions)
|
|
|
|
|
| |
| • EPS Information |
• Dividend Information |
| Analyst Coverage: No |
Dividend Yield: 0.00% |
| Current Fiscal Quarter EPS Consensus Estimate: $-2.49 |
Indicated Annual Dividend: $0.00 |
| Current Fiscal Year EPS Consensus Estimate: $-8.79 |
Payout Ratio: |
| Number of Estimates in the Fiscal Year Consensus: 3.00 |
Change In Payout Ratio: |
| Estmated Long-Term EPS Growth Rate: % |
Last Dividend Paid: NA - $0.00 |
| Next EPS Report Date: 05/26/26 |
|
|
|
| |