| Zacks Company Profile for Green Brick Partners, Inc. (GRBK : NYSE) |
|
|
| |
| • Company Description |
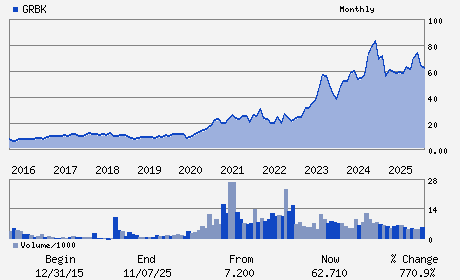
| Green Brick Partners, Inc. is involved in the land acquisition and development, entitlements, design, construction, marketing and sale of residential projects. It operates primarily in Dallas, Fort Worth, Texas, Atlanta and Georgia. Green Brick Partners, Inc., formerly known as BioFuel Energy Corp, is based in Plano, Texas.
Number of Employees: 620 |
|
|
| |
| • Price / Volume Information |
| Yesterday's Closing Price: $66.33 |
Daily Weekly Monthly
 |
| 20 Day Moving Average: 224,342 shares |
| Shares Outstanding: 43.15 (millions) |
| Market Capitalization: $2,861.87 (millions) |
| Beta: 1.85 |
| 52 Week High: $80.97 |
| 52 Week Low: $56.85 |
| Short Interest Ratio: |
| |
% Price Change |
% Price Change Relative to S&P 500 |
| 4 Week |
-7.67% |
-12.18% |
| 12 Week |
-14.62% |
-21.07% |
| Year To Date |
5.86% |
-2.38% |
|
|
|
|
| |
|
|
| |
| • General Corporate Information |
Officers
James R. Brickman - Chief Executive Officer and Director
David Einhorn - Chairman of the Board
Jeffery D. Cox - Chief Financial Officer
Elizabeth K. Blake - Director
Harry Brandler - Director
|
|
Peer Information
Green Brick Partners, Inc. (CLPO)
Green Brick Partners, Inc. (IAHM)
Green Brick Partners, Inc. (HLCO)
Green Brick Partners, Inc. (ENGEF)
Green Brick Partners, Inc. (BZH)
Green Brick Partners, Inc. (CSHHY)
|
|
Industry / Sector / Ticker Info
Analyst Coverage: No
Industry Group: BLDG-RSDNT/COMR
Sector: Construction
CUSIP: 392709101
SIC: 1531
|
|
Fiscal Year
Fiscal Year End: December
Last Reported Quarter: 03/01/26
Next Expected EPS Date: 07/29/26
|
|
Share - Related Items
Shares Outstanding: 43.15
Most Recent Split Date: 6.00 (0.05:1)
Beta: 1.85
Market Capitalization: $2,861.87 (millions)
|
|
|
|
|
| |
| • EPS Information |
• Dividend Information |
| Analyst Coverage: No |
Dividend Yield: 0.00% |
| Current Fiscal Quarter EPS Consensus Estimate: $ |
Indicated Annual Dividend: $0.00 |
| Current Fiscal Year EPS Consensus Estimate: $ |
Payout Ratio: 0.00 |
| Number of Estimates in the Fiscal Year Consensus: |
Change In Payout Ratio: 0.00 |
| Estmated Long-Term EPS Growth Rate: % |
Last Dividend Paid: NA - $0.00 |
| Next EPS Report Date: 07/29/26 |
|
|
|
| |