| Zacks Company Profile for W.W. Grainger, Inc. (GWW : NYSE) |
|
|
| |
| • Company Description |
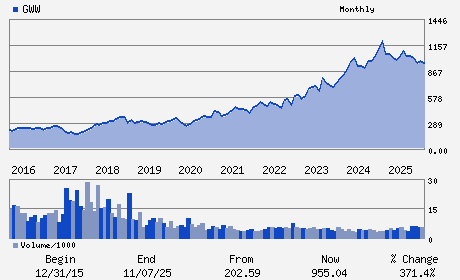
| W.W. Grainger Inc. is a broad line, business-to-business distributor of maintenance, repair and operating (MRO) products and services. Its operations are primarily in North America, Japan and the U.K. Its customers represent a wide array of industries including government, manufacturing, transportation, commercial and contractors. Its products include material-handling equipment, safety and security supplies, lighting and electrical products, power and hand tools, pumps and plumbing supplies, cleaning and maintenance supplies, and metalworking tools. Grainger has two reportable segments: High-Touch Solutions (N.A.) and Endless Assortment.
Number of Employees: 22,100 |
|
|
| |
| • Price / Volume Information |
| Yesterday's Closing Price: $1,247.79 |
Daily Weekly Monthly
 |
| 20 Day Moving Average: 278,529 shares |
| Shares Outstanding: 47.21 (millions) |
| Market Capitalization: $58,911.91 (millions) |
| Beta: 1.04 |
| 52 Week High: $1,286.56 |
| 52 Week Low: $906.52 |
| Short Interest Ratio: |
| |
% Price Change |
% Price Change Relative to S&P 500 |
| 4 Week |
7.11% |
1.88% |
| 12 Week |
12.87% |
4.34% |
| Year To Date |
23.66% |
12.91% |
|
|
|
|
| |
|
|
| |
| • General Corporate Information |
Officers
D.G. Macpherson - Chief Executive Officer & Chairman
Deidra C. Merriwether - Chief Financial Officer
Laurie R. Thomson - Vice President and Controller
Rodney C. Adkins - Director
George Davis - Director
|
|
Peer Information
W.W. Grainger, Inc. (BOOM)
W.W. Grainger, Inc. (AMBIQ)
W.W. Grainger, Inc. (DSGR)
W.W. Grainger, Inc. (MSM)
W.W. Grainger, Inc. (SIEGY)
W.W. Grainger, Inc. (MATTQ)
|
|
Industry / Sector / Ticker Info
Analyst Coverage: No
Industry Group: Industrial Services
Sector: Industrial Products
CUSIP: 384802104
SIC: 5000
|
|
Fiscal Year
Fiscal Year End: December
Last Reported Quarter: 03/01/26
Next Expected EPS Date: 08/07/26
|
|
Share - Related Items
Shares Outstanding: 47.21
Most Recent Split Date: 6.00 (2.00:1)
Beta: 1.04
Market Capitalization: $58,911.91 (millions)
|
|
|
|
|
| |
| • EPS Information |
• Dividend Information |
| Analyst Coverage: No |
Dividend Yield: 0.80% |
| Current Fiscal Quarter EPS Consensus Estimate: $11.04 |
Indicated Annual Dividend: $9.96 |
| Current Fiscal Year EPS Consensus Estimate: $45.43 |
Payout Ratio: 0.22 |
| Number of Estimates in the Fiscal Year Consensus: 7.00 |
Change In Payout Ratio: -0.03 |
| Estmated Long-Term EPS Growth Rate: 11.93% |
Last Dividend Paid: 05/11/2026 - $2.49 |
| Next EPS Report Date: 08/07/26 |
|
|
|
| |