| Zacks Company Profile for Henkel AG & Co. (HENKY : OTC) |
|
|
| |
| • Company Description |
| HENKEL KGAA ADR's principal activities are divided into four product divisions: Henkel technologies-industrial adhesives, contact adhesives and sealant; Cosmetics/toiletries-hair cosmetics, toiletries, oral and skin care, hair salon products; Detergents/household cleaners-heavy duty and specialty detergents, fabric softeners, household cleansers, kitchen care products, shoe care products, plant care products; Adhesives-adhesives, contact adhesives and sealant for consumer and craftsman.
Number of Employees: 47,200 |
|
|
| |
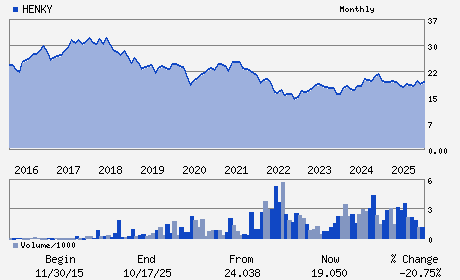
| • Price / Volume Information |
| Yesterday's Closing Price: $17.92 |
Daily Weekly Monthly
 |
| 20 Day Moving Average: 127,970 shares |
| Shares Outstanding: 1,627.15 (millions) |
| Market Capitalization: $29,158.49 (millions) |
| Beta: 0.56 |
| 52 Week High: $22.82 |
| 52 Week Low: $16.83 |
| Short Interest Ratio: |
| |
% Price Change |
% Price Change Relative to S&P 500 |
| 4 Week |
0.28% |
-4.62% |
| 12 Week |
-20.74% |
-26.73% |
| Year To Date |
-6.33% |
-13.59% |
|
|
|
|
| |
|
|
| |
| • General Corporate Information |
Officers
Carsten Knobel - Chief Executive Officer and Chairman
Birgit Helten-Kindlein - Vice Chairman
Marco Swoboda - Executive Vice President and Chief Financial Offic
Mark Dorn - Executive Vice President
Wolfgang Konig - Executive Vice President
|
|
Peer Information
Henkel AG & Co. (EPC)
Henkel AG & Co. (HPPS)
Henkel AG & Co. (ADRNY)
Henkel AG & Co. (YHGJ)
Henkel AG & Co. (GPSYY)
Henkel AG & Co. (HENKY)
|
|
Industry / Sector / Ticker Info
Analyst Coverage: No
Industry Group: CONS PD- MISC STPL
Sector: Consumer Staples
CUSIP: 42550U109
SIC: 8880
|
|
Fiscal Year
Fiscal Year End: December
Last Reported Quarter: -
Next Expected EPS Date: 05/07/26
|
|
Share - Related Items
Shares Outstanding: 1,627.15
Most Recent Split Date: 1.00 (4.00:1)
Beta: 0.56
Market Capitalization: $29,158.49 (millions)
|
|
|
|
|
| |
| • EPS Information |
• Dividend Information |
| Analyst Coverage: No |
Dividend Yield: 2.30% |
| Current Fiscal Quarter EPS Consensus Estimate: $ |
Indicated Annual Dividend: $0.41 |
| Current Fiscal Year EPS Consensus Estimate: $1.58 |
Payout Ratio: |
| Number of Estimates in the Fiscal Year Consensus: 1.00 |
Change In Payout Ratio: |
| Estmated Long-Term EPS Growth Rate: % |
Last Dividend Paid: 04/29/2026 - $0.41 |
| Next EPS Report Date: 05/07/26 |
|
|
|
| |