| Zacks Company Profile for Harte Hanks, Inc. (HHS : NSDQ) |
|
|
| |
| • Company Description |
| Harte Hanks Inc. is a data-driven, omnichannel marketing company. The company offer customer data landscape as well as the executional know-how in database build and management, data analytics, data-driven creativity, digital media, direct mail, customer contact, client fulfilment and marketing and product logistics. It operates principally in North America, Asia-Pacific and Europe. Harte Hanks Inc.is based in AUSTIN, Texas.
Number of Employees: 2,069 |
|
|
| |
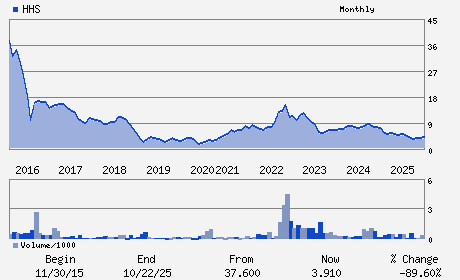
| • Price / Volume Information |
| Yesterday's Closing Price: $2.76 |
Daily Weekly Monthly
 |
| 20 Day Moving Average: 19,429 shares |
| Shares Outstanding: 7.41 (millions) |
| Market Capitalization: $20.47 (millions) |
| Beta: -0.14 |
| 52 Week High: $5.39 |
| 52 Week Low: $2.22 |
| Short Interest Ratio: |
| |
% Price Change |
% Price Change Relative to S&P 500 |
| 4 Week |
4.15% |
-1.76% |
| 12 Week |
-8.91% |
-10.82% |
| Year To Date |
-8.31% |
-10.62% |
|
|
|
|
| |
|
|
| |
| • General Corporate Information |
Officers
David Fisher - President
David Garrison - Chief Financial Officer
John H. Griffin Jr - Director
Genevieve C. Combes - Director
Liz Ross - Director
|
|
Peer Information
Harte Hanks, Inc. (IBDI)
Harte Hanks, Inc. (VAPR)
Harte Hanks, Inc. (SWWI)
Harte Hanks, Inc. (GREY)
Harte Hanks, Inc. (JCDXF)
Harte Hanks, Inc. (GMIG)
|
|
Industry / Sector / Ticker Info
Analyst Coverage: No
Industry Group: ADVERTISING/MKTG SVCS
Sector: Business Services
CUSIP: 416196202
SIC: 7331
|
|
Fiscal Year
Fiscal Year End: December
Last Reported Quarter: 12/01/25
Next Expected EPS Date: 05/13/26
|
|
Share - Related Items
Shares Outstanding: 7.41
Most Recent Split Date: 2.00 (0.10:1)
Beta: -0.14
Market Capitalization: $20.47 (millions)
|
|
|
|
|
| |
| • EPS Information |
• Dividend Information |
| Analyst Coverage: No |
Dividend Yield: 0.00% |
| Current Fiscal Quarter EPS Consensus Estimate: $ |
Indicated Annual Dividend: $0.00 |
| Current Fiscal Year EPS Consensus Estimate: $ |
Payout Ratio: |
| Number of Estimates in the Fiscal Year Consensus: |
Change In Payout Ratio: |
| Estmated Long-Term EPS Growth Rate: % |
Last Dividend Paid: NA - $0.00 |
| Next EPS Report Date: 05/13/26 |
|
|
|
| |