| Zacks Company Profile for HealthStream, Inc. (HSTM : NSDQ) |
|
|
| |
| • Company Description |
| HealthStream's suite of solutions is contracted by healthcare employees in the U.S. for workforce development, training & learning management, talent management, credentialing, privileging, provider enrollment, performance assessment and managing simulation-based education programs. HealthStream has additional offices in Jericho, New York; Boulder, Colorado; Denver, Colorado; San Diego, California; Chicago, Illinois; Portland, Oregon; and Raleigh, North Carolina.
Number of Employees: 1,160 |
|
|
| |
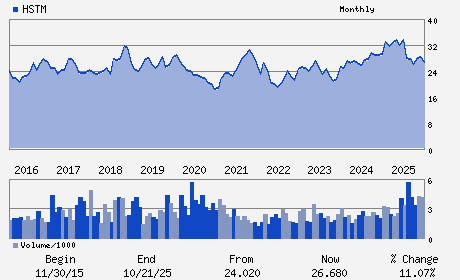
| • Price / Volume Information |
| Yesterday's Closing Price: $21.04 |
Daily Weekly Monthly
 |
| 20 Day Moving Average: 248,609 shares |
| Shares Outstanding: 29.42 (millions) |
| Market Capitalization: $619.03 (millions) |
| Beta: 0.46 |
| 52 Week High: $34.13 |
| 52 Week Low: $19.50 |
| Short Interest Ratio: |
| |
% Price Change |
% Price Change Relative to S&P 500 |
| 4 Week |
2.09% |
-3.70% |
| 12 Week |
-0.94% |
-3.02% |
| Year To Date |
-8.80% |
-11.10% |
|
|
|
|
| |
|
|
| |
| • General Corporate Information |
Officers
Robert A. Frist - Chief Executive Officer and Chairman
Scott A. Roberts - Chief Financial Officer and Senior Vice President
Thompson S. Dent - Director
Frank E. Gordon - Director
Terry AllisonRappuhn - Director
|
|
Peer Information
HealthStream, Inc. (BIZZ)
HealthStream, Inc. (DCLK)
HealthStream, Inc. (DGIN.)
HealthStream, Inc. (DVW)
HealthStream, Inc. (CYCHZ)
HealthStream, Inc. (IFXC)
|
|
Industry / Sector / Ticker Info
Analyst Coverage: No
Industry Group: INTERNET SERVICES
Sector: Computer and Technology
CUSIP: 42222N103
SIC: 7370
|
|
Fiscal Year
Fiscal Year End: December
Last Reported Quarter: 12/01/25
Next Expected EPS Date: 05/04/26
|
|
Share - Related Items
Shares Outstanding: 29.42
Most Recent Split Date: (:1)
Beta: 0.46
Market Capitalization: $619.03 (millions)
|
|
|
|
|
| |
| • EPS Information |
• Dividend Information |
| Analyst Coverage: No |
Dividend Yield: 0.67% |
| Current Fiscal Quarter EPS Consensus Estimate: $0.17 |
Indicated Annual Dividend: $0.14 |
| Current Fiscal Year EPS Consensus Estimate: $0.73 |
Payout Ratio: 0.18 |
| Number of Estimates in the Fiscal Year Consensus: 2.00 |
Change In Payout Ratio: 0.07 |
| Estmated Long-Term EPS Growth Rate: 12.00% |
Last Dividend Paid: 03/09/2026 - $0.04 |
| Next EPS Report Date: 05/04/26 |
|
|
|
| |