| Zacks Company Profile for IDEXX Laboratories, Inc. (IDXX : NSDQ) |
|
|
| |
| • Company Description |
| IDEXX Laboratories, Inc. is a developer, manufacturer and distributor of products and services primarily for the companion animal veterinary, livestock and poultry, water testing and dairy markets. The company also sells a series of portable electrolytes and blood gas analyzers for the human point-of-care medical diagnostics market.
Number of Employees: 11,000 |
|
|
| |
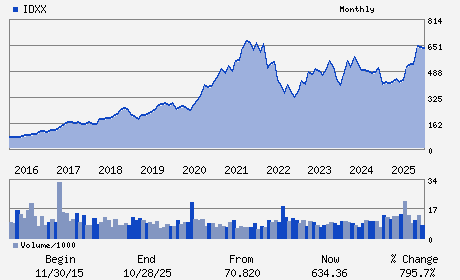
| • Price / Volume Information |
| Yesterday's Closing Price: $559.37 |
Daily Weekly Monthly
 |
| 20 Day Moving Average: 649,583 shares |
| Shares Outstanding: 78.88 (millions) |
| Market Capitalization: $44,124.79 (millions) |
| Beta: 1.58 |
| 52 Week High: $769.98 |
| 52 Week Low: $496.61 |
| Short Interest Ratio: |
| |
% Price Change |
% Price Change Relative to S&P 500 |
| 4 Week |
-0.28% |
-5.15% |
| 12 Week |
-15.34% |
-21.73% |
| Year To Date |
-17.32% |
-24.84% |
|
|
|
|
| |
|
|
| |
| • General Corporate Information |
Officers
Jonathan J. Mazelsky - President; Chief Executive Officer and Director
Lawrence D. Kingsley - Chairman
Andrew J. Emerson - Executive Vice President; Chief Financial Officer
Irene Chang Britt - Director
Bruce L. Claflin - Director
|
|
Peer Information
IDEXX Laboratories, Inc. (ABMD)
IDEXX Laboratories, Inc. (DMDS)
IDEXX Laboratories, Inc. (CPWY.)
IDEXX Laboratories, Inc. (EQUR)
IDEXX Laboratories, Inc. (ECIA)
IDEXX Laboratories, Inc. (FMS)
|
|
Industry / Sector / Ticker Info
Analyst Coverage: No
Industry Group: MED INSTRUMENTS
Sector: Medical
CUSIP: 45168D104
SIC: 2835
|
|
Fiscal Year
Fiscal Year End: December
Last Reported Quarter: 03/01/26
Next Expected EPS Date: 08/03/26
|
|
Share - Related Items
Shares Outstanding: 78.88
Most Recent Split Date: 6.00 (2.00:1)
Beta: 1.58
Market Capitalization: $44,124.79 (millions)
|
|
|
|
|
| |
| • EPS Information |
• Dividend Information |
| Analyst Coverage: No |
Dividend Yield: 0.00% |
| Current Fiscal Quarter EPS Consensus Estimate: $3.94 |
Indicated Annual Dividend: $0.00 |
| Current Fiscal Year EPS Consensus Estimate: $14.68 |
Payout Ratio: 0.00 |
| Number of Estimates in the Fiscal Year Consensus: 7.00 |
Change In Payout Ratio: 0.00 |
| Estmated Long-Term EPS Growth Rate: 11.73% |
Last Dividend Paid: NA - $0.00 |
| Next EPS Report Date: 08/03/26 |
|
|
|
| |