| Zacks Company Profile for IDEAYA Biosciences, Inc. (IDYA : NSDQ) |
|
|
| |
| • Company Description |
| IDEAYA Biosciences Inc. is an oncology-focused precision medicine company. It focuses on the discovery and development of therapeutics for patients using molecular diagnostics. The company's product pipeline consists of IDE196, MAT2A, PARG, Pol-theta and WRN which are in clinical stage. IDEAYA Biosciences Inc. is based in South San Francisco, United States.
Number of Employees: 145 |
|
|
| |
| • Price / Volume Information |
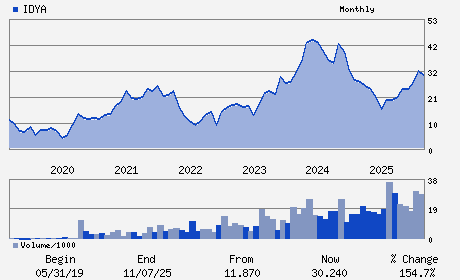
| Yesterday's Closing Price: $29.10 |
Daily Weekly Monthly
 |
| 20 Day Moving Average: 837,490 shares |
| Shares Outstanding: 87.86 (millions) |
| Market Capitalization: $2,556.76 (millions) |
| Beta: -0.04 |
| 52 Week High: $39.28 |
| 52 Week Low: $18.26 |
| Short Interest Ratio: |
| |
% Price Change |
% Price Change Relative to S&P 500 |
| 4 Week |
-5.21% |
-9.84% |
| 12 Week |
-8.78% |
-15.67% |
| Year To Date |
-15.82% |
-21.44% |
|
|
|
|
| |
|
|
| |
| • General Corporate Information |
Officers
Yujiro Hata - Chief Executive Officer and President
Terry Rosen - Chairman of the Board
Joshua Bleharski - Chief Financial Officer
Andres Ruiz Briseno - Chief Accounting Officer
Garret Hampton - Director
|
|
Peer Information
IDEAYA Biosciences, Inc. (CORR.)
IDEAYA Biosciences, Inc. (RSPI)
IDEAYA Biosciences, Inc. (CGXP)
IDEAYA Biosciences, Inc. (BGEN)
IDEAYA Biosciences, Inc. (GTBP)
IDEAYA Biosciences, Inc. (RGRX)
|
|
Industry / Sector / Ticker Info
Analyst Coverage: No
Industry Group: MED-BIOMED/GENE
Sector: Medical
CUSIP: 45166A102
SIC: 2834
|
|
Fiscal Year
Fiscal Year End: December
Last Reported Quarter: 03/01/26
Next Expected EPS Date: 08/04/26
|
|
Share - Related Items
Shares Outstanding: 87.86
Most Recent Split Date: (:1)
Beta: -0.04
Market Capitalization: $2,556.76 (millions)
|
|
|
|
|
| |
| • EPS Information |
• Dividend Information |
| Analyst Coverage: No |
Dividend Yield: 0.00% |
| Current Fiscal Quarter EPS Consensus Estimate: $-1.18 |
Indicated Annual Dividend: $0.00 |
| Current Fiscal Year EPS Consensus Estimate: $-4.28 |
Payout Ratio: |
| Number of Estimates in the Fiscal Year Consensus: 8.00 |
Change In Payout Ratio: |
| Estmated Long-Term EPS Growth Rate: % |
Last Dividend Paid: NA - $0.00 |
| Next EPS Report Date: 08/04/26 |
|
|
|
| |