| Zacks Company Profile for Inspired Entertainment, Inc. (INSE : NSDQ) |
|
|
| |
| • Company Description |
| Inspired Entertainment, Inc. is a games technology company. It engaged in supplying Virtual Sports, Mobile Gaming and Server-Based Gaming systems to regulated lottery, betting and gaming operators. Inspired Entertainment Inc., formerly known as Hydra Industries Acquisition Corp, is based in New York.
Number of Employees: 1,020 |
|
|
| |
| • Price / Volume Information |
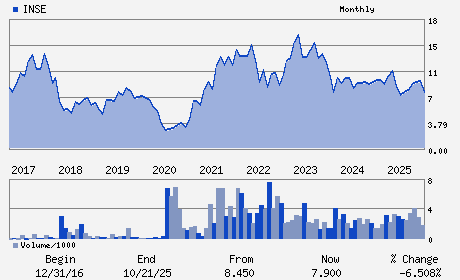
| Yesterday's Closing Price: $7.04 |
Daily Weekly Monthly
 |
| 20 Day Moving Average: 92,826 shares |
| Shares Outstanding: 26.67 (millions) |
| Market Capitalization: $187.79 (millions) |
| Beta: 1.19 |
| 52 Week High: $9.95 |
| 52 Week Low: $6.10 |
| Short Interest Ratio: |
| |
% Price Change |
% Price Change Relative to S&P 500 |
| 4 Week |
4.30% |
-0.80% |
| 12 Week |
-15.69% |
-22.06% |
| Year To Date |
-24.79% |
-29.28% |
|
|
|
|
| |
| • Address & Contact Information |
| Street Address |
Phone / Fax |
Email Address |
Web URL |
250 West 57th Street Suite 415
-
New York,NY 10107
USA |
ph: 646-565-3861
fax: - |
ir@inseinc.com |
http://www.inseinc.com |
|
|
| |
| • General Corporate Information |
Officers
A. Lorne Weil - Executive Chairman
James Richardson - Chief Financial Officer
Michael R. Chambrello - Director
Ira H. Raphaelson - Director
Desiree G. Rogers - Director
|
|
Peer Information
Inspired Entertainment, Inc. (EVOL)
Inspired Entertainment, Inc. (RAMP)
Inspired Entertainment, Inc. (EFOR)
Inspired Entertainment, Inc. (LGTY)
Inspired Entertainment, Inc. (ALOT)
Inspired Entertainment, Inc. (CXT)
|
|
Industry / Sector / Ticker Info
Analyst Coverage: No
Industry Group: Technology Services
Sector: Business Services
CUSIP: 45782N108
SIC: 7372
|
|
Fiscal Year
Fiscal Year End: December
Last Reported Quarter: 03/01/26
Next Expected EPS Date: 08/05/26
|
|
Share - Related Items
Shares Outstanding: 26.67
Most Recent Split Date: (:1)
Beta: 1.19
Market Capitalization: $187.79 (millions)
|
|
|
|
|
| |
| • EPS Information |
• Dividend Information |
| Analyst Coverage: No |
Dividend Yield: 0.00% |
| Current Fiscal Quarter EPS Consensus Estimate: $0.01 |
Indicated Annual Dividend: $0.00 |
| Current Fiscal Year EPS Consensus Estimate: $0.28 |
Payout Ratio: |
| Number of Estimates in the Fiscal Year Consensus: 1.00 |
Change In Payout Ratio: |
| Estmated Long-Term EPS Growth Rate: % |
Last Dividend Paid: NA - $0.00 |
| Next EPS Report Date: 08/05/26 |
|
|
|
| |