| Zacks Company Profile for Ionis Pharmaceuticals, Inc. (IONS : NSDQ) |
|
|
| |
| • Company Description |
| Ionis Pharmaceuticals discovers/develops RNA-targeted therapeutics using its proprietary antisense oligonucleotide technology. Its antisense medicines have been developed/are being developed to treat neurological, cardiovascular and specialty rare diseases.
Number of Employees: 1,402 |
|
|
| |
| • Price / Volume Information |
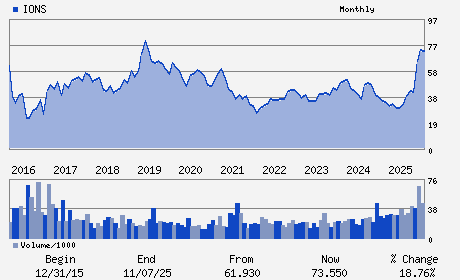
| Yesterday's Closing Price: $75.56 |
Daily Weekly Monthly
 |
| 20 Day Moving Average: 1,929,289 shares |
| Shares Outstanding: 165.26 (millions) |
| Market Capitalization: $12,487.27 (millions) |
| Beta: 0.38 |
| 52 Week High: $86.74 |
| 52 Week Low: $32.00 |
| Short Interest Ratio: |
| |
% Price Change |
% Price Change Relative to S&P 500 |
| 4 Week |
1.98% |
-3.00% |
| 12 Week |
-6.25% |
-13.34% |
| Year To Date |
-4.49% |
-11.93% |
|
|
|
|
| |
| • Address & Contact Information |
| Street Address |
Phone / Fax |
Email Address |
Web URL |
2855 GAZELLE COURT
-
CARLSBAD,CA 92010
USA |
ph: 760-931-9200
fax: 760-603-2700 |
ir@ionis.com |
https://ionis.com |
|
|
| |
| • General Corporate Information |
Officers
Brett P. Monia - Chief Executive Officer
Joseph Loscalzo - Chairman of the Board
Elizabeth L. Hougen - Executive Vice President; Finance and Chief Financ
Allene M. Diaz - Director
Joan E. Herman - Director
|
|
Peer Information
Ionis Pharmaceuticals, Inc. (GSAC)
Ionis Pharmaceuticals, Inc. (CASIF)
Ionis Pharmaceuticals, Inc. (ALCD.)
Ionis Pharmaceuticals, Inc. (OMNN)
Ionis Pharmaceuticals, Inc. (CGPI.)
Ionis Pharmaceuticals, Inc. (CATX)
|
|
Industry / Sector / Ticker Info
Analyst Coverage: No
Industry Group: MED-DRUGS
Sector: Medical
CUSIP: 462222100
SIC: 2834
|
|
Fiscal Year
Fiscal Year End: December
Last Reported Quarter: 03/01/26
Next Expected EPS Date: 07/29/26
|
|
Share - Related Items
Shares Outstanding: 165.26
Most Recent Split Date: (:1)
Beta: 0.38
Market Capitalization: $12,487.27 (millions)
|
|
|
|
|
| |
| • EPS Information |
• Dividend Information |
| Analyst Coverage: No |
Dividend Yield: 0.00% |
| Current Fiscal Quarter EPS Consensus Estimate: $-1.08 |
Indicated Annual Dividend: $0.00 |
| Current Fiscal Year EPS Consensus Estimate: $-3.77 |
Payout Ratio: |
| Number of Estimates in the Fiscal Year Consensus: 10.00 |
Change In Payout Ratio: |
| Estmated Long-Term EPS Growth Rate: % |
Last Dividend Paid: NA - $0.00 |
| Next EPS Report Date: 07/29/26 |
|
|
|
| |