| Zacks Company Profile for Inpex Corp. (IPXHY : OTC) |
|
|
| |
| • Company Description |
| Inpex Corporation engages in the research, exploration, development, production, and sale of oil, natural gas, and other mineral resources. The Company also engages in other related businesses and in investment and lending to the companies. It is also engaged in the energy supply business on a global scale. Its operations include acquisition of license blocks for oil and gas fields, exploration, production and the sale of processed products. Inpex Corporation is headquartered in Tokyo, Japan.
Number of Employees: 3,679 |
|
|
| |
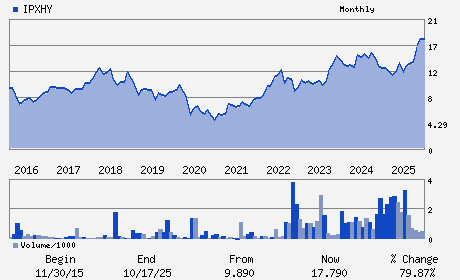
| • Price / Volume Information |
| Yesterday's Closing Price: $23.97 |
Daily Weekly Monthly
 |
| 20 Day Moving Average: 58,586 shares |
| Shares Outstanding: 1,186.02 (millions) |
| Market Capitalization: $28,422.95 (millions) |
| Beta: 0.17 |
| 52 Week High: $31.10 |
| 52 Week Low: $13.20 |
| Short Interest Ratio: |
| |
% Price Change |
% Price Change Relative to S&P 500 |
| 4 Week |
-4.02% |
-8.71% |
| 12 Week |
0.91% |
-6.72% |
| Year To Date |
20.31% |
12.39% |
|
|
|
|
| |
| • Address & Contact Information |
| Street Address |
Phone / Fax |
Email Address |
Web URL |
Akasaka Biz Tower 5-3-1 Akasaka Minato-ku
-
Tokyo,M0 107-6332
JPN |
ph: 813-5572-0200
fax: 813-5572-0205 |
None |
http://www.inpex.co.jp |
|
|
| |
| • General Corporate Information |
Officers
Takayuki Ueda - Chief Executive Officer; President and Director
Hiroshi Fujii - Senior Executive Vice President and Director
Hitoshi Okawa - Director
Daisuke Yamada - Director
Jun Yanai - Director
|
|
Peer Information
Inpex Corp. (FXEN)
Inpex Corp. (EEENF)
Inpex Corp. (BPZRQ)
Inpex Corp. (RDFEY)
Inpex Corp. (EGY)
Inpex Corp. (HBRIY)
|
|
Industry / Sector / Ticker Info
Analyst Coverage: No
Industry Group: International E&P
Sector: Oils/Energy
CUSIP: 45790H101
SIC: 1382
|
|
Fiscal Year
Fiscal Year End: December
Last Reported Quarter: 03/01/26
Next Expected EPS Date: 08/14/26
|
|
Share - Related Items
Shares Outstanding: 1,186.02
Most Recent Split Date: 8.00 (4.00:1)
Beta: 0.17
Market Capitalization: $28,422.95 (millions)
|
|
|
|
|
| |
| • EPS Information |
• Dividend Information |
| Analyst Coverage: No |
Dividend Yield: 1.77% |
| Current Fiscal Quarter EPS Consensus Estimate: $ |
Indicated Annual Dividend: $0.42 |
| Current Fiscal Year EPS Consensus Estimate: $ |
Payout Ratio: 0.20 |
| Number of Estimates in the Fiscal Year Consensus: |
Change In Payout Ratio: -0.08 |
| Estmated Long-Term EPS Growth Rate: % |
Last Dividend Paid: NA - $0.00 |
| Next EPS Report Date: 08/14/26 |
|
|
|
| |