| Zacks Company Profile for JD.com, Inc. (JD : NSDQ) |
|
|
| |
| • Company Description |
| JD.com, Inc. operates as an online direct sales company in China. The Company, through its Website www.jd.com and mobile applications offers a selection of authentic products. It offers computers; mobile handsets and other digital products, home appliances; automobile accessories; clothing and shoes; luxury goods including handbags, watches and jewelry, furniture and household products; cosmetics and other personal care items; food and nutritional supplements; books, e-books, music, movies and other media products; mother and childcare products; toys, sports and fitness equipment; and virtual goods. JD.com, Inc. is based in Beijing, China.
Number of Employees: 465,626 |
|
|
| |
| • Price / Volume Information |
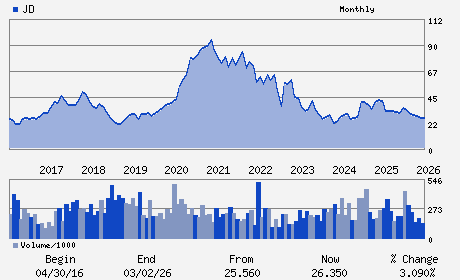
| Yesterday's Closing Price: $31.47 |
Daily Weekly Monthly
 |
| 20 Day Moving Average: 10,723,662 shares |
| Shares Outstanding: 1,432.54 (millions) |
| Market Capitalization: $45,081.88 (millions) |
| Beta: 0.36 |
| 52 Week High: $38.08 |
| 52 Week Low: $24.51 |
| Short Interest Ratio: |
| |
% Price Change |
% Price Change Relative to S&P 500 |
| 4 Week |
11.60% |
5.27% |
| 12 Week |
8.26% |
5.98% |
| Year To Date |
9.65% |
6.88% |
|
|
|
|
| |
| • Address & Contact Information |
| Street Address |
Phone / Fax |
Email Address |
Web URL |
20TH FLOOR BUILDING A NO. 18 KECHUANG 11 STREET YIZHUANG BDA
-
DAXING DISTRICT BEIJING,F4 101111
CHN |
ph: 86-10-8911-8888
fax: - |
ir@jd.com |
http://www.jd.com |
|
|
| |
| • General Corporate Information |
Officers
Sandy Ran Xu - Chief Executive Officer and Executive Director
Richard Qiangdong Liu - Chairman
Ian Su Shan - Chief Financial Officer
Ming Huang - Independent Director
Louis T. Hsieh - Independent Director
|
|
Peer Information
JD.com, Inc. (COOL.)
JD.com, Inc. (GFME)
JD.com, Inc. (GSVI)
JD.com, Inc. (GDENZ)
JD.com, Inc. (EMUS)
JD.com, Inc. (BFLY.)
|
|
Industry / Sector / Ticker Info
Analyst Coverage: No
Industry Group: INTERNET COMMERCE
Sector: Retail/Wholesale
CUSIP: 47215P106
SIC: 5990
|
|
Fiscal Year
Fiscal Year End: December
Last Reported Quarter: 12/01/25
Next Expected EPS Date: 05/12/26
|
|
Share - Related Items
Shares Outstanding: 1,432.54
Most Recent Split Date: (:1)
Beta: 0.36
Market Capitalization: $45,081.88 (millions)
|
|
|
|
|
| |
| • EPS Information |
• Dividend Information |
| Analyst Coverage: No |
Dividend Yield: 3.11% |
| Current Fiscal Quarter EPS Consensus Estimate: $0.88 |
Indicated Annual Dividend: $0.98 |
| Current Fiscal Year EPS Consensus Estimate: $2.53 |
Payout Ratio: 0.47 |
| Number of Estimates in the Fiscal Year Consensus: 4.00 |
Change In Payout Ratio: 0.34 |
| Estmated Long-Term EPS Growth Rate: 1.37% |
Last Dividend Paid: 04/09/2026 - $0.98 |
| Next EPS Report Date: 05/12/26 |
|
|
|
| |