| Zacks Company Profile for KalVista Pharmaceuticals, Inc. (KALV : NSDQ) |
|
|
| |
| • Company Description |
| KalVista Pharmaceuticals, Inc. is a pharmaceuticals company. It engages in discovery, development and commercialization of small molecule protease inhibitors for diseases with significant unmet need. Its product portfolio consist hereditary angioedema and diabetic macular edema, KVD818 and KVD001, which are in clinical stage. KalVista Pharmaceuticals, Inc., formerly known as Carbylan Therapeutics, Inc., is headquartered in Cambridge, United States.
Number of Employees: 270 |
|
|
| |
| • Price / Volume Information |
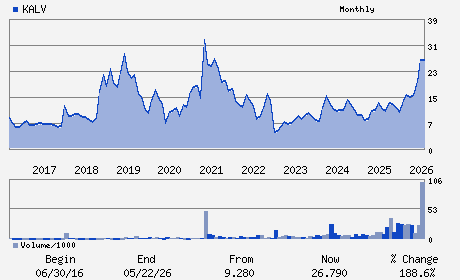
| Yesterday's Closing Price: $26.79 |
Daily Weekly Monthly
 |
| 20 Day Moving Average: 7,435,951 shares |
| Shares Outstanding: 53.24 (millions) |
| Market Capitalization: $1,426.33 (millions) |
| Beta: -0.12 |
| 52 Week High: $26.85 |
| 52 Week Low: $9.83 |
| Short Interest Ratio: |
| |
% Price Change |
% Price Change Relative to S&P 500 |
| 4 Week |
40.41% |
33.55% |
| 12 Week |
69.99% |
57.15% |
| Year To Date |
65.88% |
52.40% |
|
|
|
|
| |
| • Address & Contact Information |
| Street Address |
Phone / Fax |
Email Address |
Web URL |
200 CROSSING BOULEVARD
-
FRAMINGHAM,MA 01702
USA |
ph: 857-999-0075
fax: 866-553-3269 |
ir@kalvista.com |
http://www.kalvista.com |
|
|
| |
| • General Corporate Information |
Officers
Benjamin L. Palleiko - Chief Executive Officer
Brian J.G. Pereira - Chairman
Brian Piekos - Chief Financial Officer
William Fairey - Director
Laurence Reid - Director
|
|
Peer Information
- (-)
- (-)
- (-)
- (-)
- (-)
- (-)
|
|
Industry / Sector / Ticker Info
Analyst Coverage: No
Industry Group: MED-DRUGS
Sector: Medical
CUSIP: 483497103
SIC: 2834
|
|
Fiscal Year
Fiscal Year End: December
Last Reported Quarter: 03/01/26
Next Expected EPS Date: -
|
|
Share - Related Items
Shares Outstanding: 53.24
Most Recent Split Date: 11.00 (0.07:1)
Beta: -0.12
Market Capitalization: $1,426.33 (millions)
|
|
|
|
|
| |
| • EPS Information |
• Dividend Information |
| Analyst Coverage: No |
Dividend Yield: 0.00% |
| Current Fiscal Quarter EPS Consensus Estimate: $-0.26 |
Indicated Annual Dividend: $0.00 |
| Current Fiscal Year EPS Consensus Estimate: $-0.96 |
Payout Ratio: |
| Number of Estimates in the Fiscal Year Consensus: 5.00 |
Change In Payout Ratio: |
| Estmated Long-Term EPS Growth Rate: 32.67% |
Last Dividend Paid: NA - $0.00 |
| Next EPS Report Date: - |
|
|
|
| |