| Zacks Company Profile for LGI Homes, Inc. (LGIH : NSDQ) |
|
|
| |
| • Company Description |
| LGI Homes, Inc. is engaged in the design and construction of entry-level homes across Texas, Arizona, Florida and Georgia. The company focuses on converting renters of apartments and single-family homes into homeowners by offering homes at affordable locations. LGI Homes, Inc. is headquartered in The Woodlands, Texas.
Number of Employees: 1,056 |
|
|
| |
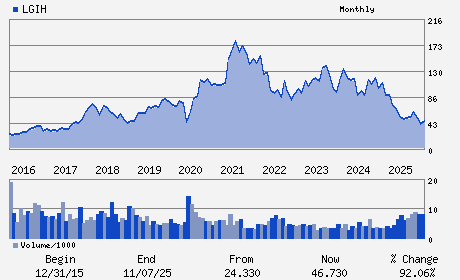
| • Price / Volume Information |
| Yesterday's Closing Price: $46.11 |
Daily Weekly Monthly
 |
| 20 Day Moving Average: 462,184 shares |
| Shares Outstanding: 23.23 (millions) |
| Market Capitalization: $1,071.23 (millions) |
| Beta: 1.90 |
| 52 Week High: $69.50 |
| 52 Week Low: $33.55 |
| Short Interest Ratio: |
| |
% Price Change |
% Price Change Relative to S&P 500 |
| 4 Week |
1.90% |
-3.08% |
| 12 Week |
-11.26% |
-17.96% |
| Year To Date |
7.33% |
-1.06% |
|
|
|
|
| |
|
|
| |
| • General Corporate Information |
Officers
Eric Lipar - Chief Executive Officer and Chairman of the Board
Michael Snider - President and Chief Operating Officer
Charles Merdian - Chief Financial Officer and Treasurer
Scott Garber - General Counsel and Corporate Secretary
Shailee Parikh - Director
|
|
Peer Information
LGI Homes, Inc. (CLPO)
LGI Homes, Inc. (IAHM)
LGI Homes, Inc. (HLCO)
LGI Homes, Inc. (ENGEF)
LGI Homes, Inc. (BZH)
LGI Homes, Inc. (CSHHY)
|
|
Industry / Sector / Ticker Info
Analyst Coverage: No
Industry Group: BLDG-RSDNT/COMR
Sector: Construction
CUSIP: 50187T106
SIC: 1531
|
|
Fiscal Year
Fiscal Year End: December
Last Reported Quarter: 03/01/26
Next Expected EPS Date: 08/04/26
|
|
Share - Related Items
Shares Outstanding: 23.23
Most Recent Split Date: (:1)
Beta: 1.90
Market Capitalization: $1,071.23 (millions)
|
|
|
|
|
| |
| • EPS Information |
• Dividend Information |
| Analyst Coverage: No |
Dividend Yield: 0.00% |
| Current Fiscal Quarter EPS Consensus Estimate: $0.84 |
Indicated Annual Dividend: $0.00 |
| Current Fiscal Year EPS Consensus Estimate: $2.76 |
Payout Ratio: 0.00 |
| Number of Estimates in the Fiscal Year Consensus: 1.00 |
Change In Payout Ratio: 0.00 |
| Estmated Long-Term EPS Growth Rate: % |
Last Dividend Paid: NA - $0.00 |
| Next EPS Report Date: 08/04/26 |
|
|
|
| |