| Zacks Company Profile for Lite Strategy, Inc. (LITS : NSDQ) |
|
|
| |
| • Company Description |
| MEI Pharma, Inc. is an oncology company focused on the clinical development of novel therapeutics targeting cancer metabolism. The Company is focused on the clinical development of its two lead isoflavone-based drug candidates, ME-143 and ME-344. MEI Pharma, Inc., formerly known as Marshall Edwards, Inc., is based in San Diego.
Number of Employees: 4 |
|
|
| |
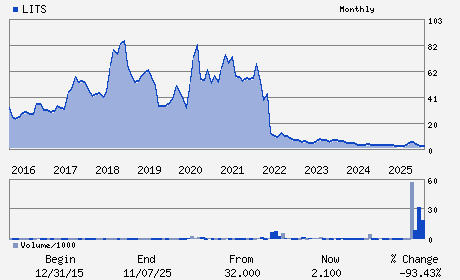
| • Price / Volume Information |
| Yesterday's Closing Price: $1.07 |
Daily Weekly Monthly
 |
| 20 Day Moving Average: 357,788 shares |
| Shares Outstanding: 34.03 (millions) |
| Market Capitalization: $36.41 (millions) |
| Beta: 0.25 |
| 52 Week High: $9.00 |
| 52 Week Low: $0.95 |
| Short Interest Ratio: |
| |
% Price Change |
% Price Change Relative to S&P 500 |
| 4 Week |
-9.32% |
-13.75% |
| 12 Week |
-6.14% |
-13.23% |
| Year To Date |
-18.94% |
-23.38% |
|
|
|
|
| |
|
|
| |
| • General Corporate Information |
Officers
Justin J. File - Chief Executive Officer; Chief Financial Officer a
Thomas C. Reynolds - Director
Nicholas R. Glover - Director
James Flynn - Director
Frederick W. Driscoll - Director
|
|
Peer Information
Lite Strategy, Inc. (GSAC)
Lite Strategy, Inc. (CASIF)
Lite Strategy, Inc. (ALCD.)
Lite Strategy, Inc. (OMNN)
Lite Strategy, Inc. (CGPI.)
Lite Strategy, Inc. (CATX)
|
|
Industry / Sector / Ticker Info
Analyst Coverage: No
Industry Group: MED-DRUGS
Sector: Medical
CUSIP: 55279B301
SIC: 2834
|
|
Fiscal Year
Fiscal Year End: June
Last Reported Quarter: 03/01/26
Next Expected EPS Date: 09/25/26
|
|
Share - Related Items
Shares Outstanding: 34.03
Most Recent Split Date: 4.00 (0.05:1)
Beta: 0.25
Market Capitalization: $36.41 (millions)
|
|
|
|
|
| |
| • EPS Information |
• Dividend Information |
| Analyst Coverage: No |
Dividend Yield: 0.00% |
| Current Fiscal Quarter EPS Consensus Estimate: $ |
Indicated Annual Dividend: $0.00 |
| Current Fiscal Year EPS Consensus Estimate: $ |
Payout Ratio: |
| Number of Estimates in the Fiscal Year Consensus: |
Change In Payout Ratio: |
| Estmated Long-Term EPS Growth Rate: % |
Last Dividend Paid: NA - $0.00 |
| Next EPS Report Date: 09/25/26 |
|
|
|
| |