| Zacks Company Profile for Cheniere Energy, Inc. (LNG : NYSE) |
|
|
| |
| • Company Description |
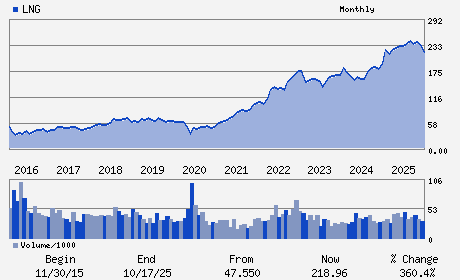
| Cheniere Energy Inc. is primarily engaged in businesses related to liquefied natural gas (or LNG) through its two business segments: LNG terminal; and LNG and natural gas marketing. The company, through its controlling interest in Cheniere Energy Partners L.P., owns and operates the Sabine Pass LNG terminal in Louisiana - North America's first large-scale liquefied gas export facility. Furthermore, Cheniere Energy owns and operates the 94-mile Creole Trail Pipeline - an interconnect between the Sabine Pass receiving terminal and the downstream markets - through its subsidiary.
Number of Employees: 1,717 |
|
|
| |
| • Price / Volume Information |
| Yesterday's Closing Price: $257.78 |
Daily Weekly Monthly
 |
| 20 Day Moving Average: 2,980,432 shares |
| Shares Outstanding: 210.14 (millions) |
| Market Capitalization: $54,169.09 (millions) |
| Beta: 0.14 |
| 52 Week High: $300.89 |
| 52 Week Low: $186.20 |
| Short Interest Ratio: |
| |
% Price Change |
% Price Change Relative to S&P 500 |
| 4 Week |
-12.49% |
-18.78% |
| 12 Week |
25.30% |
23.78% |
| Year To Date |
32.61% |
28.51% |
|
|
|
|
| |
|
|
| |
| • General Corporate Information |
Officers
Jack A. Fusco - President and Chief Executive Officer
G. Andrea Botta - Chairman of the Board
Zach Davis - Executive Vice President and Chief Financial Offic
David Slack - Senior Vice President and Chief Accounting Officer
Denise Gray - Director
|
|
Peer Information
Cheniere Energy, Inc. (AEGG)
Cheniere Energy, Inc. (CHAR)
Cheniere Energy, Inc. (CECX.)
Cheniere Energy, Inc. (DLOV)
Cheniere Energy, Inc. (WACC)
Cheniere Energy, Inc. (DVN)
|
|
Industry / Sector / Ticker Info
Analyst Coverage: No
Industry Group: OIL-US EXP&PROD
Sector: Oils/Energy
CUSIP: 16411R208
SIC: 4924
|
|
Fiscal Year
Fiscal Year End: December
Last Reported Quarter: 12/01/25
Next Expected EPS Date: 05/07/26
|
|
Share - Related Items
Shares Outstanding: 210.14
Most Recent Split Date: 4.00 (2.00:1)
Beta: 0.14
Market Capitalization: $54,169.09 (millions)
|
|
|
|
|
| |
| • EPS Information |
• Dividend Information |
| Analyst Coverage: No |
Dividend Yield: 0.86% |
| Current Fiscal Quarter EPS Consensus Estimate: $2.86 |
Indicated Annual Dividend: $2.22 |
| Current Fiscal Year EPS Consensus Estimate: $14.31 |
Payout Ratio: 0.13 |
| Number of Estimates in the Fiscal Year Consensus: 8.00 |
Change In Payout Ratio: 0.02 |
| Estmated Long-Term EPS Growth Rate: % |
Last Dividend Paid: 02/06/2026 - $0.56 |
| Next EPS Report Date: 05/07/26 |
|
|
|
| |