| Zacks Company Profile for Light & Wonder, Inc. (LNWO : OTC) |
|
|
| |
| • Company Description |
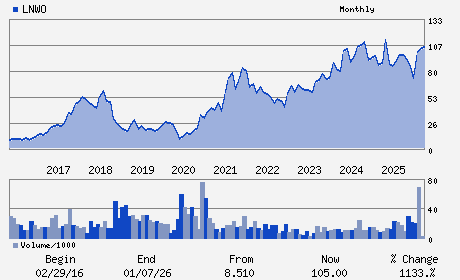
| Light & Wonder Inc. is a cross-platform games and entertainment company. Its OpenGaming(TM) platform powers digital-gaming network in the industry. Light & Wonder Inc., formerly known as Scientific Games Corporation, is based in LAS VEGAS.
Number of Employees: 6,800 |
|
|
| |
| • Price / Volume Information |
| Yesterday's Closing Price: $86.93 |
Daily Weekly Monthly
 |
| 20 Day Moving Average: 75,510 shares |
| Shares Outstanding: 77.15 (millions) |
| Market Capitalization: $6,706.54 (millions) |
| Beta: 1.46 |
| 52 Week High: $122.65 |
| 52 Week Low: $69.56 |
| Short Interest Ratio: |
| |
% Price Change |
% Price Change Relative to S&P 500 |
| 4 Week |
9.21% |
2.47% |
| 12 Week |
-23.19% |
-24.58% |
| Year To Date |
-15.68% |
-18.02% |
|
|
|
|
| |
| • Address & Contact Information |
| Street Address |
Phone / Fax |
Email Address |
Web URL |
6601 BERMUDA ROAD
-
LAS VEGAS,NV 89119
USA |
ph: 702-897-7150
fax: 702-897-2284 |
ir@lnw.com |
http://www.lnw.com |
|
|
| |
| • General Corporate Information |
Officers
Matthew R. Wilson - President and Chief Executive Officer
Jamie R. Odell - Chair of the Board of Directors
Antonia Korsanos - Vice Chair of the Board of Directors
Oliver Chow - Executive Vice President; Chief Financial Officer
Vanja Kalabic - Senior Vice President and Chief Accounting Officer
|
|
Peer Information
Light & Wonder, Inc. (CHLD.)
Light & Wonder, Inc. (FGRD)
Light & Wonder, Inc. (CGMI.)
Light & Wonder, Inc. (AGAM.)
Light & Wonder, Inc. (ASCA.)
Light & Wonder, Inc. (BYD)
|
|
Industry / Sector / Ticker Info
Analyst Coverage: No
Industry Group: GAMING
Sector: Consumer Discretionary
CUSIP: 80874P109
SIC: 7373
|
|
Fiscal Year
Fiscal Year End: December
Last Reported Quarter: 12/01/25
Next Expected EPS Date: 05/06/26
|
|
Share - Related Items
Shares Outstanding: 77.15
Most Recent Split Date: 10.00 (2.00:1)
Beta: 1.46
Market Capitalization: $6,706.54 (millions)
|
|
|
|
|
| |
| • EPS Information |
• Dividend Information |
| Analyst Coverage: No |
Dividend Yield: 0.00% |
| Current Fiscal Quarter EPS Consensus Estimate: $1.76 |
Indicated Annual Dividend: $0.00 |
| Current Fiscal Year EPS Consensus Estimate: $7.43 |
Payout Ratio: 0.00 |
| Number of Estimates in the Fiscal Year Consensus: 3.00 |
Change In Payout Ratio: 0.00 |
| Estmated Long-Term EPS Growth Rate: % |
Last Dividend Paid: NA - $0.00 |
| Next EPS Report Date: 05/06/26 |
|
|
|
| |