| Zacks Company Profile for Lonking Holdings Ltd. (LONKF : OTC) |
|
|
| |
| • Company Description |
| Lonking Holdings Limited operates as construction machinery manufacturer in China engaged in the manufacture of wheel loaders, excavators, road roller, motor graders and forklifts. The company also develops and produces core components, including gearboxes, torque converters, axle, hydraulic components, gear pipes and driver shaft and etc. Lonking Holdings Limited is headquartered in Shanghai, China.
Number of Employees: |
|
|
| |
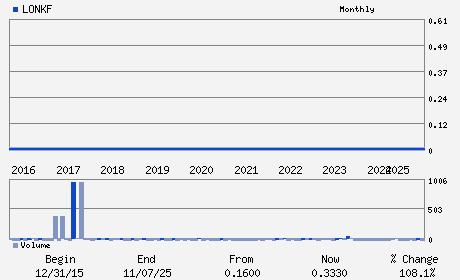
| • Price / Volume Information |
| Yesterday's Closing Price: $0.36 |
Daily Weekly Monthly
 |
| 20 Day Moving Average: 0 shares |
| Shares Outstanding: 4,280.10 (millions) |
| Market Capitalization: $1,548.97 (millions) |
| Beta: -0.04 |
| 52 Week High: $0.38 |
| 52 Week Low: $0.33 |
| Short Interest Ratio: |
| |
% Price Change |
% Price Change Relative to S&P 500 |
| 4 Week |
0.00% |
-4.88% |
| 12 Week |
0.00% |
-7.55% |
| Year To Date |
8.68% |
-0.08% |
|
|
|
|
| |
| • Address & Contact Information |
| Street Address |
Phone / Fax |
Email Address |
Web URL |
No. 26 Mingyi Road
-
Shanghai,F4 201612
CHN |
ph: 86-21-3760-2242
fax: 86-21-57687966-8436 |
lzz@lonking.cn |
http://www.lonking.cn |
|
|
| |
| • General Corporate Information |
Officers
Li San Yim - Chairman and Chief Executive Officer
Ngai Ngan Ying - Director
Chen Chao - Director
Zheng Ke Wen - Director
Yin Kun Lun - Director
|
|
Peer Information
Lonking Holdings Ltd. (ASTE)
Lonking Holdings Ltd. (EMAT)
Lonking Holdings Ltd. (MTW)
Lonking Holdings Ltd. (KMTUY)
Lonking Holdings Ltd. (JOY)
Lonking Holdings Ltd. (CMI.)
|
|
Industry / Sector / Ticker Info
Analyst Coverage: No
Industry Group: MACH-CONST/MNG
Sector: Industrial Products
CUSIP: G5636C107
SIC: 3531
|
|
Fiscal Year
Fiscal Year End: December
Last Reported Quarter: -
Next Expected EPS Date: -
|
|
Share - Related Items
Shares Outstanding: 4,280.10
Most Recent Split Date: (:1)
Beta: -0.04
Market Capitalization: $1,548.97 (millions)
|
|
|
|
|
| |
| • EPS Information |
• Dividend Information |
| Analyst Coverage: No |
Dividend Yield: 0.00% |
| Current Fiscal Quarter EPS Consensus Estimate: $ |
Indicated Annual Dividend: $0.00 |
| Current Fiscal Year EPS Consensus Estimate: $ |
Payout Ratio: |
| Number of Estimates in the Fiscal Year Consensus: |
Change In Payout Ratio: |
| Estmated Long-Term EPS Growth Rate: % |
Last Dividend Paid: NA - $0.00 |
| Next EPS Report Date: - |
|
|
|
| |