| Zacks Company Profile for Maze Therapeutics, Inc. (MAZE : NSDQ) |
|
|
| |
| • Company Description |
| Maze Therapeutics Inc. is a clinical-stage biopharmaceutical company harnessing the power of human genetics to develop novel, small molecule precision medicines for patients living with renal, cardiovascular and related metabolic diseases. Maze Therapeutics Inc. is based in SOUTH SAN FRANCISCO, Calif.
Number of Employees: 141 |
|
|
| |
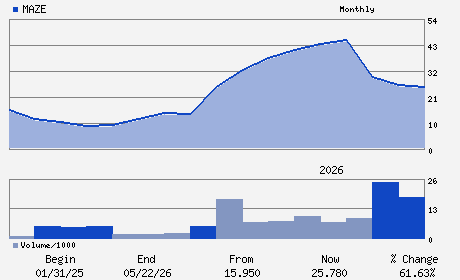
| • Price / Volume Information |
| Yesterday's Closing Price: $25.78 |
Daily Weekly Monthly
 |
| 20 Day Moving Average: 527,519 shares |
| Shares Outstanding: 55.35 (millions) |
| Market Capitalization: $1,426.79 (millions) |
| Beta: 2.50 |
| 52 Week High: $53.65 |
| 52 Week Low: $9.73 |
| Short Interest Ratio: |
| |
% Price Change |
% Price Change Relative to S&P 500 |
| 4 Week |
-0.88% |
-5.73% |
| 12 Week |
-43.76% |
-48.01% |
| Year To Date |
-37.77% |
-42.86% |
|
|
|
|
| |
| • Address & Contact Information |
| Street Address |
Phone / Fax |
Email Address |
Web URL |
171 OYSTER POINT BOULEVARD SUITE 300
-
SAN FRANCISCO,CA 94080
USA |
ph: 650-850-5070
fax: - |
abachrodt@mazetx.com |
http://www.mazetx.com |
|
|
| |
| • General Corporate Information |
Officers
Jason Coloma - Chief Executive Officer and Director
Herve Hoppenot - Chairman
Misbah Tahir - Chief Financial Officer
Amy Bachrodt - Senior Vice President; Finance
Charles Homcy - Director
|
|
Peer Information
Maze Therapeutics, Inc. (CORR.)
Maze Therapeutics, Inc. (RSPI)
Maze Therapeutics, Inc. (CGXP)
Maze Therapeutics, Inc. (BGEN)
Maze Therapeutics, Inc. (GTBP)
Maze Therapeutics, Inc. (RGRX)
|
|
Industry / Sector / Ticker Info
Analyst Coverage: No
Industry Group: MED-BIOMED/GENE
Sector: Medical
CUSIP: 578784100
SIC: 2836
|
|
Fiscal Year
Fiscal Year End: December
Last Reported Quarter: 03/01/26
Next Expected EPS Date: 08/11/26
|
|
Share - Related Items
Shares Outstanding: 55.35
Most Recent Split Date: (:1)
Beta: 2.50
Market Capitalization: $1,426.79 (millions)
|
|
|
|
|
| |
| • EPS Information |
• Dividend Information |
| Analyst Coverage: No |
Dividend Yield: 0.00% |
| Current Fiscal Quarter EPS Consensus Estimate: $-0.75 |
Indicated Annual Dividend: $0.00 |
| Current Fiscal Year EPS Consensus Estimate: $-2.74 |
Payout Ratio: |
| Number of Estimates in the Fiscal Year Consensus: 8.00 |
Change In Payout Ratio: |
| Estmated Long-Term EPS Growth Rate: % |
Last Dividend Paid: NA - $0.00 |
| Next EPS Report Date: 08/11/26 |
|
|
|
| |