| Zacks Company Profile for MasterBrand, Inc. (MBC : NYSE) |
|
|
| |
| • Company Description |
| MasterBrand Inc. is a manufacturer of residential cabinets principally in North America. It offers a comprehensive portfolio of residential cabinetry products for the kitchen, bathroom and other parts of the home. MasterBrand Inc. is based in JASPER, Ind.
Number of Employees: 12,000 |
|
|
| |
| • Price / Volume Information |
| Yesterday's Closing Price: $8.57 |
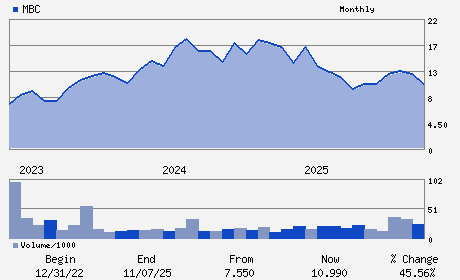
Daily Weekly Monthly
 |
| 20 Day Moving Average: 2,130,873 shares |
| Shares Outstanding: 127.54 (millions) |
| Market Capitalization: $1,092.99 (millions) |
| Beta: 1.67 |
| 52 Week High: $14.22 |
| 52 Week Low: $7.38 |
| Short Interest Ratio: |
| |
% Price Change |
% Price Change Relative to S&P 500 |
| 4 Week |
10.87% |
4.58% |
| 12 Week |
-34.03% |
-35.41% |
| Year To Date |
-22.37% |
-24.33% |
|
|
|
|
| |
|
|
| |
| • General Corporate Information |
Officers
R. David Banyard - Chief Executive Officer; President & Director
David D. Petratis - Non-Executive Chairman of the Board
Andrea H. Simon - Executive Vice President & Chief Financial Officer
Mark A. Young - Vice President & Chief Accounting Officer
Catherine Y. Courage - Director
|
|
Peer Information
MasterBrand, Inc. (DMIF.)
MasterBrand, Inc. (NCL)
MasterBrand, Inc. (FCPR)
MasterBrand, Inc. (AMWD)
MasterBrand, Inc. (SNBR)
MasterBrand, Inc. (MLKN)
|
|
Industry / Sector / Ticker Info
Analyst Coverage: No
Industry Group: FURNITURE
Sector: Consumer Discretionary
CUSIP: 57638P104
SIC: 2511
|
|
Fiscal Year
Fiscal Year End: December
Last Reported Quarter: 12/01/25
Next Expected EPS Date: 05/05/26
|
|
Share - Related Items
Shares Outstanding: 127.54
Most Recent Split Date: (:1)
Beta: 1.67
Market Capitalization: $1,092.99 (millions)
|
|
|
|
|
| |
| • EPS Information |
• Dividend Information |
| Analyst Coverage: No |
Dividend Yield: 0.00% |
| Current Fiscal Quarter EPS Consensus Estimate: $ |
Indicated Annual Dividend: $0.00 |
| Current Fiscal Year EPS Consensus Estimate: $ |
Payout Ratio: 0.00 |
| Number of Estimates in the Fiscal Year Consensus: |
Change In Payout Ratio: 0.00 |
| Estmated Long-Term EPS Growth Rate: % |
Last Dividend Paid: NA - $0.00 |
| Next EPS Report Date: 05/05/26 |
|
|
|
| |