| Zacks Company Profile for MetroCity Bankshares, Inc. (MCBS : NSDQ) |
|
|
| |
| • Company Description |
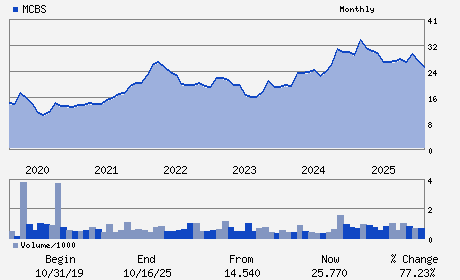
| MetroCity Bankshares Inc. is a bank holding company for its wholly-owned banking subsidiary, Metro City Bank. It offers savings accounts, debit and credit cards, business and personal loans, mortgages, cash management, line of credit, online banking and e-statements. The company operates primarily in Alabama, Florida, Georgia, New York, New Jersey, Texas and Virginia. MetroCity Bankshares Inc. is based in ATLANTA, Ga.
Number of Employees: 317 |
|
|
| |
| • Price / Volume Information |
| Yesterday's Closing Price: $32.62 |
Daily Weekly Monthly
 |
| 20 Day Moving Average: 70,783 shares |
| Shares Outstanding: 28.66 (millions) |
| Market Capitalization: $935.03 (millions) |
| Beta: 0.72 |
| 52 Week High: $33.67 |
| 52 Week Low: $24.50 |
| Short Interest Ratio: |
| |
% Price Change |
% Price Change Relative to S&P 500 |
| 4 Week |
3.31% |
-1.74% |
| 12 Week |
13.09% |
4.54% |
| Year To Date |
22.93% |
13.49% |
|
|
|
|
| |
| • Address & Contact Information |
| Street Address |
Phone / Fax |
Email Address |
Web URL |
5114 BUFORD HIGHWAY
-
DORAVILLE,GA 30340
USA |
ph: 770-455-4989
fax: - |
None |
http://www.metrocitybank.bank |
|
|
| |
| • General Corporate Information |
Officers
Nack Y. Paek - Chairman and Chief Executive Officer
Farid Tan - President
Lucas Stewart - Executive Vice President and Chief Financial Offic
Frank Glover - Director
William J. Hungeling - Director
|
|
Peer Information
MetroCity Bankshares, Inc. (TSFG)
MetroCity Bankshares, Inc. (ABCB)
MetroCity Bankshares, Inc. (CFNL)
MetroCity Bankshares, Inc. (CPKF)
MetroCity Bankshares, Inc. (HIB)
MetroCity Bankshares, Inc. (FVB)
|
|
Industry / Sector / Ticker Info
Analyst Coverage: No
Industry Group: BANKS-SOUTHEAST
Sector: Finance
CUSIP: 59165J105
SIC: 6022
|
|
Fiscal Year
Fiscal Year End: December
Last Reported Quarter: 03/01/26
Next Expected EPS Date: 07/17/26
|
|
Share - Related Items
Shares Outstanding: 28.66
Most Recent Split Date: (:1)
Beta: 0.72
Market Capitalization: $935.03 (millions)
|
|
|
|
|
| |
| • EPS Information |
• Dividend Information |
| Analyst Coverage: No |
Dividend Yield: 3.56% |
| Current Fiscal Quarter EPS Consensus Estimate: $ |
Indicated Annual Dividend: $1.16 |
| Current Fiscal Year EPS Consensus Estimate: $ |
Payout Ratio: 0.36 |
| Number of Estimates in the Fiscal Year Consensus: |
Change In Payout Ratio: 0.05 |
| Estmated Long-Term EPS Growth Rate: % |
Last Dividend Paid: 04/29/2026 - $0.29 |
| Next EPS Report Date: 07/17/26 |
|
|
|
| |