| Zacks Company Profile for Manulife Financial Corp (MFC : NYSE) |
|
|
| |
| • Company Description |
| Manulife Financial Corporation one of the dominant life insurers. Manulife reports earnings through six divisions and has five major operating divisions - Asia, Canada, U.S. Insurance and U.S. Wealth Management and Corporate. The Global Wealth and Asset Management offers a broad range of personal and family-oriented wealth management products and services focused on individuals and business markets. The segment has three core business lines - John Hancock Wealth Asset Management, John Hancock Variable Annuities and John Hancock Fixed Products. Corporate and Other is comprised of the earnings on assets backing capital. The Canadian division offers a diverse portfolio of products, services and distribution channels. The segment also markets life, health and specialty products, such as travel insurance, to consumers through a number of alternative distribution channels. Through Manulife Bank, the segment offers a variety of lending products including fixed and variable rate mortgages.
Number of Employees: 37,000 |
|
|
| |
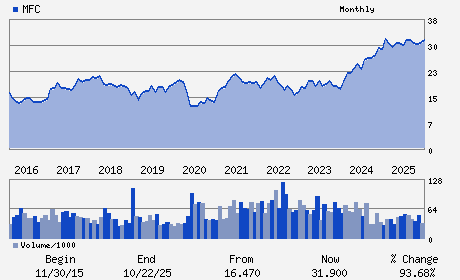
| • Price / Volume Information |
| Yesterday's Closing Price: $38.53 |
Daily Weekly Monthly
 |
| 20 Day Moving Average: 2,343,406 shares |
| Shares Outstanding: 1,668.89 (millions) |
| Market Capitalization: $64,302.37 (millions) |
| Beta: 0.87 |
| 52 Week High: $40.41 |
| 52 Week Low: $29.70 |
| Short Interest Ratio: |
| |
% Price Change |
% Price Change Relative to S&P 500 |
| 4 Week |
-0.31% |
-5.18% |
| 12 Week |
7.57% |
-0.56% |
| Year To Date |
6.20% |
-1.07% |
|
|
|
|
| |
|
|
| |
| • General Corporate Information |
Officers
Phil Witherington - Chief Executive Officer and President
Don Lindsay - Chairman of the Board of Directors
Rahul Joshi - Chief Operations Officer
Colin Simpson - Chief Financial Officer
Pragashini Fox - Chief People Officer
|
|
Peer Information
Manulife Financial Corp (AGC.)
Manulife Financial Corp (T.GWO)
Manulife Financial Corp (AMH.2)
Manulife Financial Corp (CSLI.)
Manulife Financial Corp (CIA)
Manulife Financial Corp (DFG)
|
|
Industry / Sector / Ticker Info
Analyst Coverage: No
Industry Group: INS-LIFE
Sector: Finance
CUSIP: 56501R106
SIC: 6311
|
|
Fiscal Year
Fiscal Year End: December
Last Reported Quarter: 03/01/26
Next Expected EPS Date: 08/05/26
|
|
Share - Related Items
Shares Outstanding: 1,668.89
Most Recent Split Date: 6.00 (2.00:1)
Beta: 0.87
Market Capitalization: $64,302.37 (millions)
|
|
|
|
|
| |
| • EPS Information |
• Dividend Information |
| Analyst Coverage: No |
Dividend Yield: 3.70% |
| Current Fiscal Quarter EPS Consensus Estimate: $0.80 |
Indicated Annual Dividend: $1.42 |
| Current Fiscal Year EPS Consensus Estimate: $3.19 |
Payout Ratio: 0.46 |
| Number of Estimates in the Fiscal Year Consensus: 2.00 |
Change In Payout Ratio: 0.04 |
| Estmated Long-Term EPS Growth Rate: % |
Last Dividend Paid: 02/25/2026 - $0.36 |
| Next EPS Report Date: 08/05/26 |
|
|
|
| |