| Zacks Company Profile for MARKER THERAPEUTICS, INC. (MRKR : NSDQ) |
|
|
| |
| • Company Description |
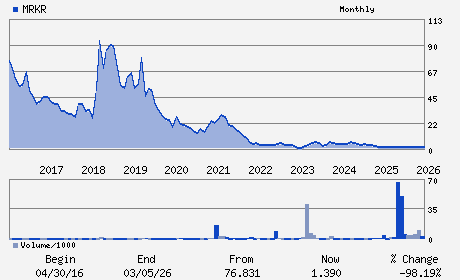
| Marker Therapeutics, Inc. is a clinical-stage immuno-oncology company specializing in the development of innovative peptide and nucleic acid-based immunotherapeutic vaccines for the treatment and eradication of cancer, including metastatic cancer. The company's product pipeline consists of MultiTAA T Cell Therapy, TPIV200 and TPIV100/110 which are in clinical stage. Marker Therapeutics Inc., formerly known as TapImmune Inc., is based in FL, United States.
Number of Employees: 5 |
|
|
| |
| • Price / Volume Information |
| Yesterday's Closing Price: $1.40 |
Daily Weekly Monthly
 |
| 20 Day Moving Average: 64,565 shares |
| Shares Outstanding: 16.67 (millions) |
| Market Capitalization: $23.34 (millions) |
| Beta: 1.43 |
| 52 Week High: $2.46 |
| 52 Week Low: $0.81 |
| Short Interest Ratio: |
| |
% Price Change |
% Price Change Relative to S&P 500 |
| 4 Week |
-3.45% |
-8.16% |
| 12 Week |
-11.39% |
-18.09% |
| Year To Date |
-6.04% |
-11.76% |
|
|
|
|
| |
|
|
| |
| • General Corporate Information |
Officers
Juan Vera - President; Chief Executive Officer and Treasurer;
N. David Eansor - Chairman
Katharine Knobil - Director
Steve Elms - Director
Kathryn Penkus Corzo - Director
|
|
Peer Information
MARKER THERAPEUTICS, INC. (GSAC)
MARKER THERAPEUTICS, INC. (CASIF)
MARKER THERAPEUTICS, INC. (ALCD.)
MARKER THERAPEUTICS, INC. (OMNN)
MARKER THERAPEUTICS, INC. (CGPI.)
MARKER THERAPEUTICS, INC. (CATX)
|
|
Industry / Sector / Ticker Info
Analyst Coverage: No
Industry Group: MED-DRUGS
Sector: Medical
CUSIP: 57055L206
SIC: 2834
|
|
Fiscal Year
Fiscal Year End: December
Last Reported Quarter: 03/01/26
Next Expected EPS Date: 08/13/26
|
|
Share - Related Items
Shares Outstanding: 16.67
Most Recent Split Date: 1.00 (0.10:1)
Beta: 1.43
Market Capitalization: $23.34 (millions)
|
|
|
|
|
| |
| • EPS Information |
• Dividend Information |
| Analyst Coverage: No |
Dividend Yield: 0.00% |
| Current Fiscal Quarter EPS Consensus Estimate: $-0.25 |
Indicated Annual Dividend: $0.00 |
| Current Fiscal Year EPS Consensus Estimate: $-1.17 |
Payout Ratio: |
| Number of Estimates in the Fiscal Year Consensus: 2.00 |
Change In Payout Ratio: |
| Estmated Long-Term EPS Growth Rate: % |
Last Dividend Paid: NA - $0.00 |
| Next EPS Report Date: 08/13/26 |
|
|
|
| |